
He’s been called the Oracle of Omaha, and even the greatest living value investor. Berkshire Hathaway CEO Warren Buffett is so highly regarded for his time-tested investment approach that he really needs no introduction. The Buffett Indicator, his somewhat less famous method for assessing overall market valuation, may require some explanation.
If the name Buffett is practically synonymous with value investing, then it makes sense that the Buffett Indicator has something to do with measuring value. Buffett is known to be plain-spoken, and the indicator that bears his name is simple yet surprisingly powerful.
A Well-Timed Warning
Buffett hasn’t often spoken directly on his methodology for gauging whether U.S. stocks, overall, are cheap, pricey, or somewhere in between. Fortunately, Fortune magazine recorded and archived a rare instance of Buffett directly addressing this topic at the turn of the millennium. As you may recall (if you’re old enough), this was a time when the Internet was relatively new to the public and the prevailing sentiment on Wall Street was that technology stocks could and would keep going up indefinitely.
This was a perfect time for Buffett to provide a warning that just maybe, the American stock market was a tad overvalued. He cited a ratio that would include “the market value of all publicly traded securities as a percentage of the country’s business – that is, as a percentage of GNP.”
After calling this ratio “probably the best single measure of where valuations stand at any given moment,” Buffett observed that at that time, “nearly two years ago the ratio rose to an unprecedented level. That should have been a very strong warning signal.”
Hindsight is always 20/20, but it’s certainly evident that Buffett was 100% right to raise a red flag about stock valuations. Unfortunately, it was only after the dot-com bubble burst in mid-2000 and the NASDAQ plunged more than 50% that some traders would learn a harsh lesson about the consequences of buying hype.
Breaking Down the Formula
The Buffett Indicator might have been a year or two early in heralding a stock-market crash, but there’s certainly value in gauging euphoria in the market. After all, it’s better to be too early in exiting a trade than too late.
While Buffett referred to GNP or gross national product (which calculates the total value of goods and services produced by U.S. residents domestically and abroad), economists have generally changed over to GDP or gross domestic product (which is limited to what’s produced by U.S. residents within the country’s borders). Today, GDP is often used as a rough-and-ready way to measure the value of what a nation is producing, and by inference, how economically healthy that nation is at that moment.
If GDP is the numerator of Buffett’s ratio, then the denominator would be “the market value of all publicly traded securities.” Now, this phrase might bring the S&P 500 to mind, but that index only comprises 500 large-cap companies. Instead, then, the denominator should be the FT Wilshire 5000 Total Market Full Cap Index, which the Federal Reserve acknowledges as a way to measure the total value of the U.S. stock market.
After dividing the current value of the FT Wilshire 5000 Total Market Full Cap Index by the nation’s GDP, you’ll probably end up with a decimal of some sort. Typically, this would be converted into a percentage by multiplying by 100. Voila – you’re now using the Buffett Indicator.
Buffet Indicator = FT Wilshire 5000 Total Market Full Cap Index / GDP
History Repeats Itself
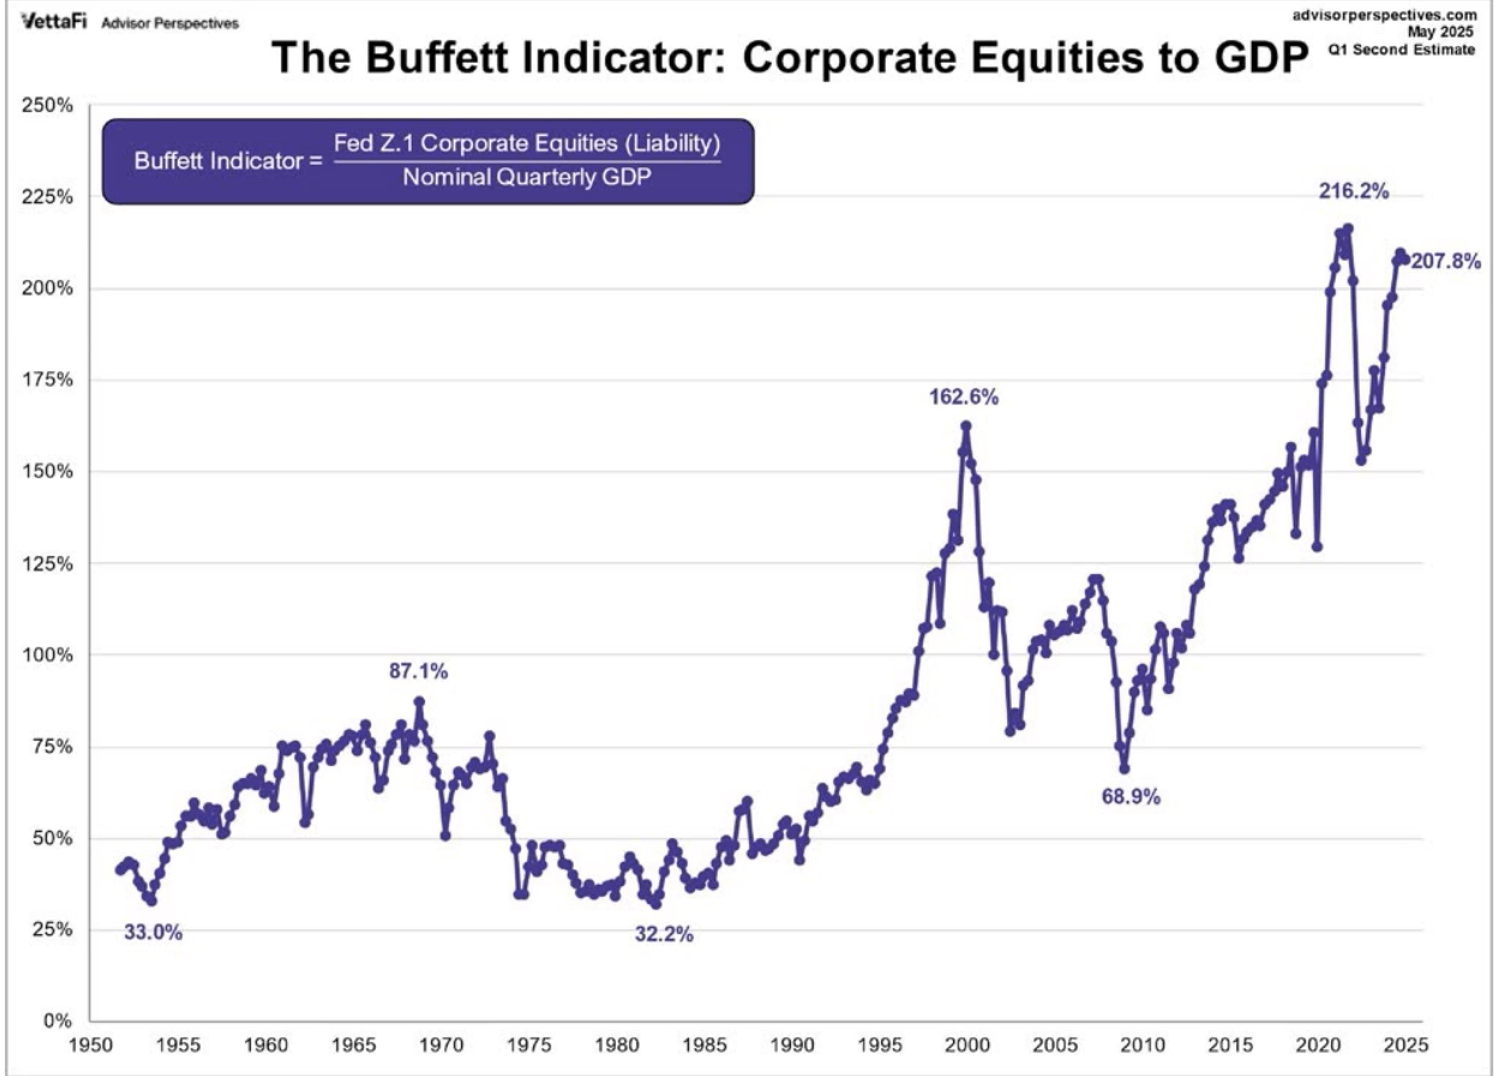
Though Buffett might be a better investor than instructor, at least he provided some basic guidelines on how much is too much in regard to the Buffett Indicator. As he explained during the dot-com collapse, “If the percentage relationship falls to the 70% or 80% area, buying stocks is likely to work very well for you. If the ratio approaches 200% – as it did in 1999 and a part of 2000 – you are playing with fire. As you can see, the ratio was recently 133%.”
Indeed, the Federal Reserve’s iteration of the Buffett Indicator confirms that it was elevated above 100% prior to the bursting of the dot-com bubble. The Fed’s version of the Indicator didn’t approach 200% like Buffett’s version may have done in 1999-2000, but even exceeding 100% could mean that investors are “playing with fire.” After all, a reading above 100% seems to suggest that stocks are generally more expensive than they ought to be, given the health of the nation’s economy.
So, was the Buffett Indicator a reliable predictor of U.S. stock-market crashes after the dot-com collapse? Let’s take a closer look.
The Buffett Indicator did indeed indicate that stocks were getting ahead of themselves prior to the next two crashes. For instance, the Fed’s version of the Indicator peaked above 100% in 2007’s third quarter, not long before the Great Recession that commenced in 2008.
The lead-up to the next stock-market crash is where the usefulness of the Buffett Indicator might be called into question. The Fed’s version of the Indicator topped 100% in the first quarter of 2013 – and, it has stayed above 100% since that time, including through the recession of 2020. Staying out of the stock market from early 2013 through today would have meant missing out on a large portion of one of the most lucrative bull markets in recent history.
The Buffett Indicator reached a peak of 202% in January 2025, indicating significant market overvaluation.
Valuing a Valuation Metric
Buffett himself acknowledged that the ratio of the stock market’s value to the country’s GDP “has certain limitations in telling you what you need to know.” He didn’t provide much detail on those limitations at that time, but the aforementioned example of 2013 through 2022, at least, suggests that being too reactive to lofty Buffett Indicator readings could mean leaving a whole lot of money on the proverbial table.
The Buffett Indicator is a guide to whether the market as a whole is overvalued or undervalued, and will not help you assess the valuation of any specific stock or sector.
In the final analysis, then, the Buffett Indicator may be most useful when combined with common-sense observations of stock-market-versus-economy dynamics. Are share prices relentlessly going up even while businesses and people are struggling? Are corporate earnings lagging while retail traders are feverishly buying stocks (like they did in 1999)?
When the Buffett Indicator is going parabolic – and more importantly, when Wall Street doesn’t reflect what’s happening on Main Street – then just maybe, it’s time to choose prudence over profits.