The “S&P 500” or “SPX” is to Standard & Poor’s index of the stocks of the 500 largest corporations in the United States. These 500 stocks serve as a barometer of how the stock market is doing. There are indexes that track all kinds of stocks, from small companies to global corporations, but the S&P 500 is considered reliable and indicates how stocks are generally doing.
What is Standard & Poor’s?
Standard & Poor’s, known today as S&P Global, is a company that issues credit ratings for companies and other borrowers. It is also well known for treating financial market indices, which are often used as industry benchmarks. S&P creates and manages many indices, but the S&P 500 is by far the best known and most widely used.
The Value of the S&P 500
If you read that the S&P is at a level of 3,805.17, that number does not represent dollars. It represents points, based on a point system developed by Standard & Poor’s. You may read that the S&P is up 200 points or down 100 points, and this means that the index indicates stock values are up or down on average.
It is easier to understand if you read or listen for what percentage the S&P 500 is up or down. It makes more sense to realize the index went up 2% or fell 10% instead of trying to guess what all the points mean.
It is even easier when you follow charts that show the ups and downs of prices. There are some excellent free sites that give you access to charts.
When the S&P 500 Is Up, Does That Mean All 500 Stocks Are Up?
No. Any individual stock in the group can be down, and the index could still be up. It is more like an average measurement of all the stocks taken together. Some stocks can go in the opposite direction of the overall index, but most will go in the same direction as the index.
Weighting
Though we can informally refer to the point value of the S&P as an average, in reality, it is not an actual average. Instead, Standard & Poor’s assigns a “weight” to stocks. Some stocks are more heavily weighted, meaning their movements will affect the point value of the index more.
Companies are weighted by market capitalization. That is simply the number of outstanding shares multiplied by the share price. “Outstanding shares” means the shares currently owned by shareholders.
Standard & Poor’s adds up all the market capitalization of each of the 500 companies, then divided by 500. The idea is that the larger companies affect the index movement more than the smaller ones do.
How Companies Get Included in the S&P 500
For a company to become part of the S&P 500, it must:
- Be an American company.
- Have a market capitalization of no less than $20.5 billion.
- Have no less than 50% of its shares being sold on exchanges
- Trade on a major exchange, such as the New York Stock Exchange or the Nasdaq.
- Show positive earnings in the most recent quarter.
- Show positive earnings for the past four quarters.
- Have a minimum monthly trading volume of 250,000 shares in each of the six months leading up to the evaluation date.
Companies can get “delisted” if they don’t meet the above requirements. Standard & Poor’s will generally give notice to a company that it needs to improve to stay in the index.
How to Understand Trends in the S&P 500 Index
When you hear that one day the S&P is up and the next day is down, you may get confused as to what that means. It can sound like a bouncing ball that goes this way and that way without any orderly progression.
But there is a simple way to follow the S&P 500 and understand what it means for investors. The S&P is an average of all the stock prices in it. And those prices will trend either upward or downward over time.
If you look at a chart, you can see the trends easily. The line shows the price average over time.
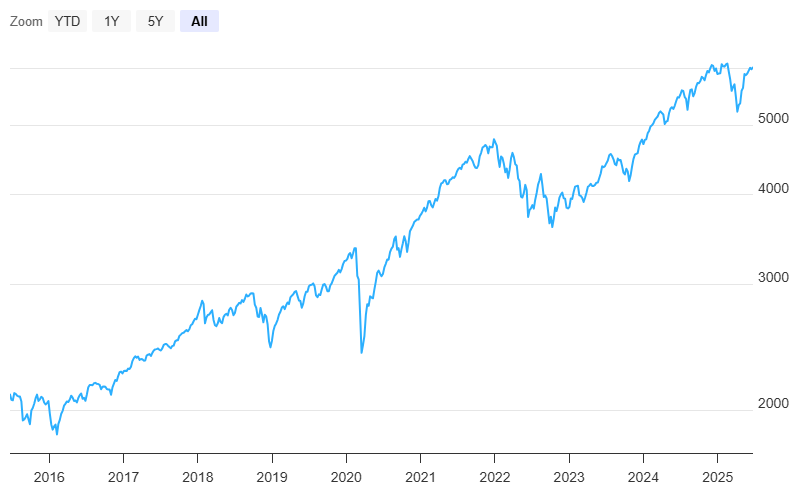
Chart courtesy of Macrotrends
If the trend is generally up, a few down days here and there won’t change the fact that prices are rising over the long haul. How long is “long?” A trend can remain in place for weeks, months, or years.
These patterns are not random. The uptrend occurred when investors expected businesses to keep doing better, and the downtrend happened when investors anticipated that companies would start doing worse.
So how did investors know this would happen? They didn’t. It was an educated guess. When you put together all the educated guesses, you get either a positive or a negative trend. The reason trends are reliable is that there are so many investors that the average sentiment tends to be right over time.
All the zigzags you see within the trends come from investors who thought the movement would start going the other way. At some point, any trend will reverse, but as you can see, many people are wrong about when that will occur.
What is the Dow Jones Industrial Average?
You will also hear the Dow Jones quoted. It is an index much like the S&P 500, but it only has 30 stocks. These are the largest corporations that trade publicly.
Why Broader is Better
Since the S&P offers a look at more stocks than the Dow, it is a reliable measure of how the markets are doing. Though the Dow will always remain popular, many consider the S&P the go-to index to monitor the health of stocks.
The S&P Is Not the Economy
Many investors get confused about the stock market vs. the economy. They do not always rise and fall in lockstep.
This is because investors tend to look at least six months out to make their decisions. For example, you might see news of a recession hitting the economy, yet prices go up for the S&P. That’s because the recession may have been “priced in.” Those who wanted to get out of the market have probably already done so when the recession actually hits. Now they are looking another six months out and may see brighter days ahead.
How Can I Use the S&P 500?
There are a couple of ways you can benefit from the S&P 500:
- Stay abreast of how the market is doing.
- This index is a good measure of the overall market. You can keep your finger on the pulse of how stocks are doing.
- Invest in the S&P 500.
- Though the index itself does not accept investment money, you can invest through S&P 500 exchange-traded funds (ETFs).
Investing in S&P 500 ETFs
Companies offer a fund that holds all 500 stocks in the S&P 500. You can buy shares in such a fund just like you would buy shares in a stock. But you are purchasing all 500 stocks of the S&P every time you buy a share of the ETF.
These ETFs are designed to track the S&P 500 index, so you can expect your investment to grow (or dip) according to how the index does.
Here are some S&P 500 index ETFs to look at:
- SPDR S&P 500 ETF (SPY)
- iShares Core S&P 500 ETF (IVV)
- Vanguard S&P 500 ETF (VOO)
- SPDR Portfolio S&P 500 ETF (SPLG)
- iShares S&P 500 Growth ETF (IVW)
- Invesco S&P 500 Equal Weight ETF (RSP)
Enter the symbols in parentheses on any financial website, such as Yahoo Finance, and you will see the details and charts on each ETF.
📗 Further Reading: There is a great deal more to investing than anticipating the trends of the S&P 500, so if you want to learn more, read about how to get started.