
When Warren Buffet dies, 90% of his wealth will be invested in an index fund that tracks the general market, the S&P 500, to be exact[1].
But why would Warren Buffet, one of history’s best stock pickers and active investors, choose such a passive strategy for his immense wealth once he’s gone?
There are several reasons:
- 64% American traders lose money in the stock market.
- Active management entails fees that erode the possibility of real profit.
- Passive investing is cheap in comparison.
- The general market has provided passive investors with a steady rate of return when averaged over a long period of time.
Buffet is so certain of the superiority of passive investing that back in 2007, he made a bet with a money management firm in New York. He wagered that over a 10-year period, the S&P 500 would outperform any 5 hedge funds grouped together.
10 years later, Warren Buffet shared in his letter to shareholders the results of the bet: He’d won.
So, suppose you were to follow the Oracle of Omaha and passively invest in the market. What average return can you expect?
The Average Stock Market Rate of Return
Historically, the stock market has been growing at a compound annual rate of 10%[2]. And, when you consider inflation, which usually hovers around 3-4%, the compounded annual rate of return drops to about 7% per year[3].
Now, there’s a lot to unpack here:
- How do we measure the stock market rate of return?
- What is the impact of inflation on an investor’s returns?
- How reliable are these averages?
Let’s take a closer look.
How Do We Measure the Average Rate of Return?
Simply, we track a proxy, aka something representative of the stock market as a whole, and look at its growth year-over-year.
Like most analysts, we use the S&P 500 as a stand-in for the broader market.
What is the S&P 500 Index?
The S&P 500 is a basket of the largest 500 companies in the stock market. These 500 companies represent around 80% of the entire stock market capitalization. In simpler terms, for every $100 put in the stock market, almost $80 ends up in one of those 500 companies.
As a result, the S&P 500 is an effective representation of the broader stock market.
How Do We Track the Growth of the S&P 500?
First of all, we track growth over a specific time period. So, if we look at the index’s growth during a given year, we would look at where the basket started at the beginning of the year and where it finished by the end. The difference gives us a growth percentage.
For instance, if you invested $100 in the S&P 500, and one year later, you collected $110, then the index would have had an annual rate of return of 10%.
Here are the annual rates of return of the S&P 500 over the past 20 years:
| Year | Annual return with dividends | Year | Annual return with dividends |
|---|---|---|---|
| 2003 | 28.36% | 2013 | 32.15% |
| 2004 | 10.74% | 2014 | 13.52% |
| 2005 | 4.83% | 2015 | 1.38% |
| 2006 | 15.61% | 2016 | 11.77% |
| 2007 | 5.48% | 2017 | 21.61% |
| 2008 | -36.55% | 2018 | -4.23% |
| 2009 | 25.94% | 2019 | 31.21% |
| 2010 | 14.82% | 2020 | 18.02% |
| 2011 | 2.10% | 2021 | 28.47% |
| 2012 | 15.89% | 2022 | 18.01% |
Source: Aswath Damodaran, NYU Stern School of Business
How Do We Understand the S&P 500’s Annual Rates of Return?
As you go over the above table, there are a few things you should bear in mind:
- The returns vary wildly from year to year. Some years saw losses, such as 2008 and 2018.
- Losses and gains are not equal. A 50% loss can wipe out a 100% gain.
- The rates above take into the accumulation of dividends as well as capital gains.
- The above rates are nominal rates. They look at the returns before considering taxes, fees, and inflation. If we deduct all costs incurred by investors, we get the real rates of return.
- The S&P 500 grows at an exponential rate, also called a compounded rate, rather than a linear rate. So, if it had an average annual rate of return of 10%, then it would grow by 159% within 10 years, not 100%.
We can see that there are good years and bad years, as expected, but how do they average out over the long haul?
What is the Average Return Over Periods Longer Than a Year?
Annual returns tend to be very volatile, so investors prefer to inspect long-term rates of return over 5 years, 10 years, or even 30 years.
The calculation is quite similar: You look at where the index started and where it finished. The difference gives you the rate of return over that period. So, if $100 invested in the S&P turned to $300 5 years later, then the 5-year rate of return would be 200%.
However, things get tricky when you calculate the average annual rate of return over that period. Remember: Since investments grow exponentially, you can’t divide the total return after 5 years by 5. Instead, you need to use this formula:
🧮️ Average Annual rate of return = (((Total return/100+1)^(1/number of years))-1)*100
Using the above formula, you will find that a 200% 5-year return translates to an average annual rate of return of 24.5%.
With that said, here are the returns of the S&P500 over different time scales as of the time of this writing: (And, to make the numbers more tangible, we included how much a $100 investment in the S&P 500 would have grown over that time period.)
| Time horizon | Cumulative return | Average Annual Rate of Return | The return of a $100 investment |
|---|---|---|---|
| 5 years | 63.20% | 10.12% | $163.20 |
| 10 years | 239.79% | 12.9% | $339.79 |
| 20 years | 583.97% | 10.05% | $683.97 |
| 30 years | 1596.35% | 9.87% | $1696.35 |
There are a few things worth highlighting in the above table:
- When taken over long periods of time, the average annual rates of return of the S&P become much more stable and consistent in comparison to the annual returns we saw above. They average around 10%.
- The cumulative 30-year return is almost 3 times the 20-year return even though the average annual return is less during the thirty-year period. This shows two important things: the power of compounded growth and the importance of time in the investment world.
- All the above returns are nominal, so they don’t account for inflation.
Let’s see what happens when we rectify that omission.
How Does Inflation Affect an Investor’s Returns?
Inflation in an economy raises prices, impacting the purchasing power of money. As a result, $100 today can’t even come close to what that same $100 could have bought 30 years ago.
To see the effect of inflation, let’s look at the prices of used cars over the past decade:
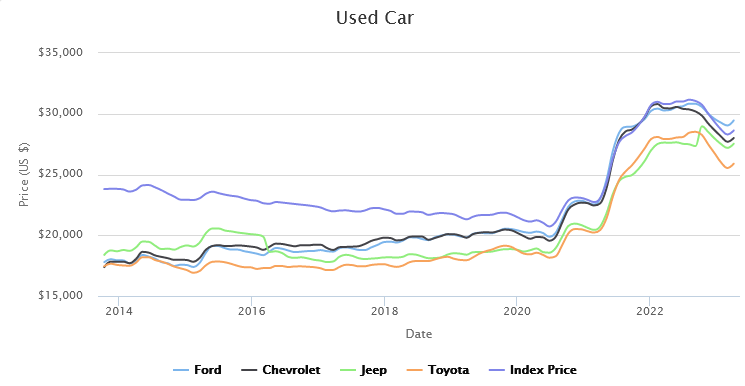
Source: cargurus.com
As the chart above shows, while the prices of different brands might have fluctuated over the years, they all increased over the past decade. So, you might have been able to buy a decent used Toyota for a little over $15,000 back in 2013, but today, you will need a tad over $25,000.
During that same decade, $15,000 invested in the S&P 500 would have grown to $50,850, buying two Toyotas at today’s price.
And this is how inflation impacts your investments: In nominal terms, your investment of $15,000 more than tripled in the decade between 2013 and 2023. In actual buying power, your investment barely doubled.
How Does Inflation Affect the S&P 500’s Returns?
When economists measure inflation, they don’t rely on the used car market. Instead, they use something called the consumer price index, or CPI for short, which looks at several consumer goods and averages their collective price. Then, they chart the increase in prices of the CPI to calculate the annual inflation.
Historically, the annual inflation rate in the states has been 3.8%.
Let’s see how this inflation rate affects our S&P average annual returns:
| Time period | Nominal annual rate of return | Real annual rate of return |
|---|---|---|
| 5 years | 10.12% | 6.21% |
| 10 years | 12.9% | 10.03% |
| 20 years | 10.05% | 7.37% |
| 30 years | 9.87% | 7.21% |
Although the difference between the nominal and real returns might seem meager (after all, it’s only 3-4%), this difference becomes massive when you look at its cumulative effect. Here are the cumulative nominal and real rates of return:
| Time period | Nominal cumulative rate of return | Real cumulative rate of return |
|---|---|---|
| 5 years | 63.20% | 35.84% |
| 10 years | 238.79% | 162.25% |
| 20 years | 583.97% | 316.95% |
| 30 years | 1596.35% | 712.11% |
| 50 years | 13,964.77% | 1,968.92% |
Inflation of 3-4 % will cut your nominal cumulative rate of return by more than half in thirty years. And if you want to see how big of an impact inflation can have, look at the 50-year S&P return (the average annual inflation rate over those fifty years was around 4%).
Can You Expect an Average Annual Return of 10% Next Year?
Well, the short answer is no.
The S&P 500 has provided investors with steady gains, but this consistency needs time to materialize. There are a few reasons you should not expect the S&P 500 to provide you with 10% this time next year:
1. The Stock Market is Volatile
As we saw in the table above, the S&P 500 can be erratic, churning out varying results yearly. But, according to the above table, here are some things to notice about the performance of the index over the past 20 years:
- There were 2 years when investors lost money, and one (2008) was so devastating that investors lost more than one-third of their money.
- There were 4 years where the S&P 500 grew by only single-digit percentages, such as 1.38% in 2015 and 4.83% in 2005.
- There were 5 years where the index grew by 2.5-3 times its average annual rate of 10%.
- Only 2 years, 2004 and 2016, fall in the average range we’d typically expect.
- A lot of the wild swings can be attributed to global events we can all remember. For instance, the 2008 plunge is due to the financial crisis. When COVID-19 first hit, the stock market experienced a short bear market, losing almost one-third of its value in a month!
Those fluctuations can have a dramatic impact on your returns.
2. Market timing Can Affect Annual Returns
As we just saw, the stock market recently lost around 35% of its value in one month. So, if you had invested $100 in the S&P 500 in April 2019, all your gains for 2019 would have been wiped out by that month, and your annual rate of return by March 2020 would be -8.81%.
And this is the problem: Large events, outliers, and black swans can skew your results. Market timing matters a lot.
Even while researching this piece, I found the S&P 500 5-year and 10-year returns to vary greatly, depending on when you measured them.
10-year average stock market returns over the last year have been volatile.
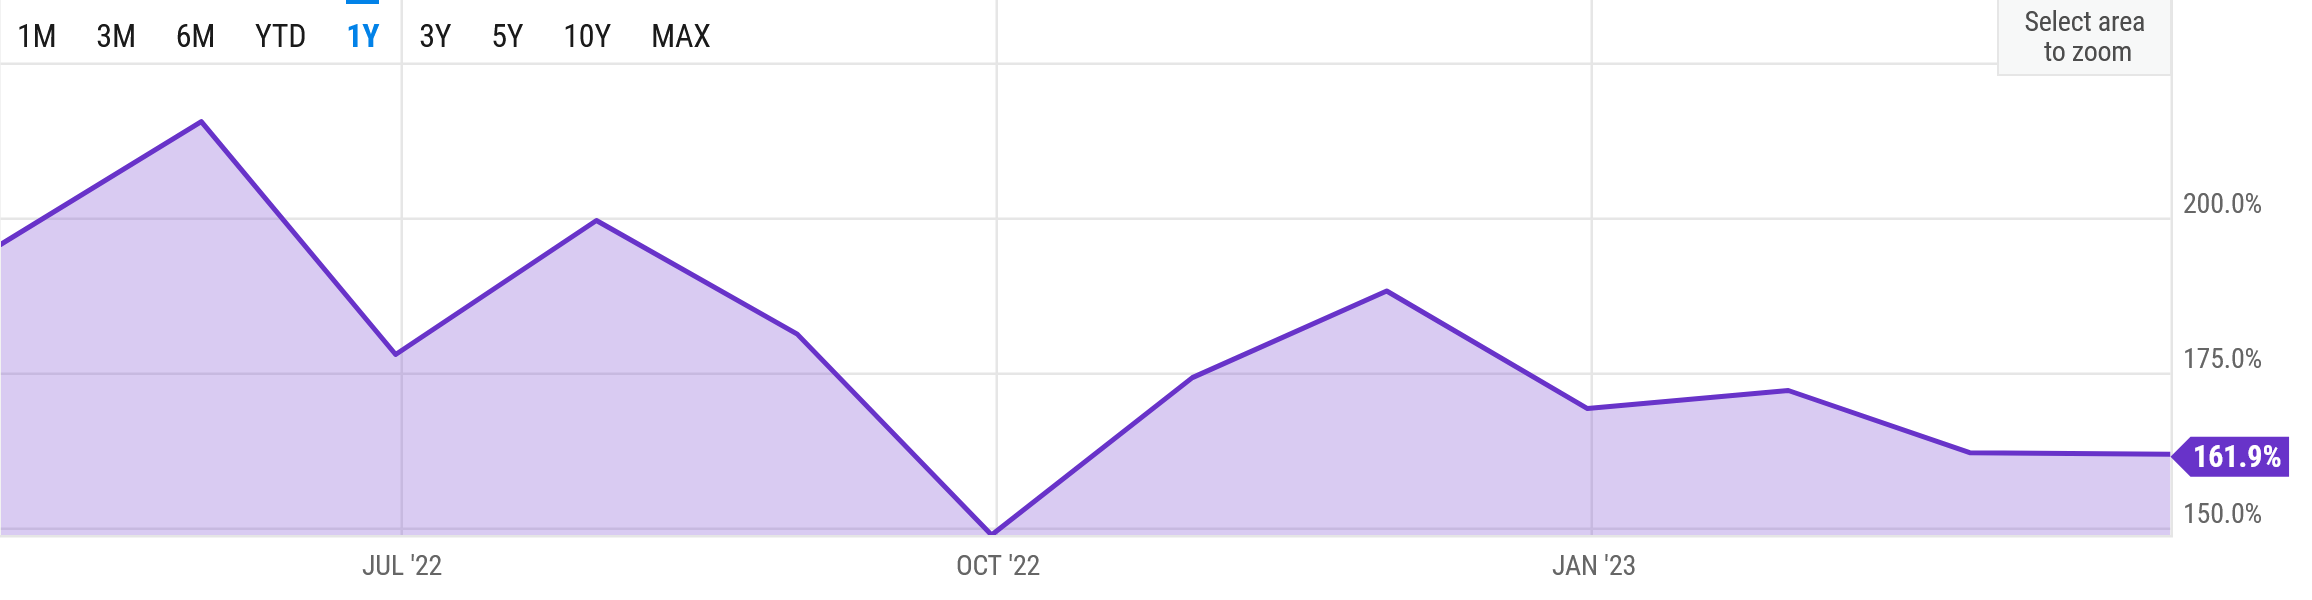
Source: Y-charts
If I had measured the cumulative 10-year S&P return back in May 2022, I would have found it to be more than 200%.
And, if we even take a step back further, we will see larger fluctuations:
10-year average stock market return during the last 5 years is even more volatile than its 1-year counterpart.
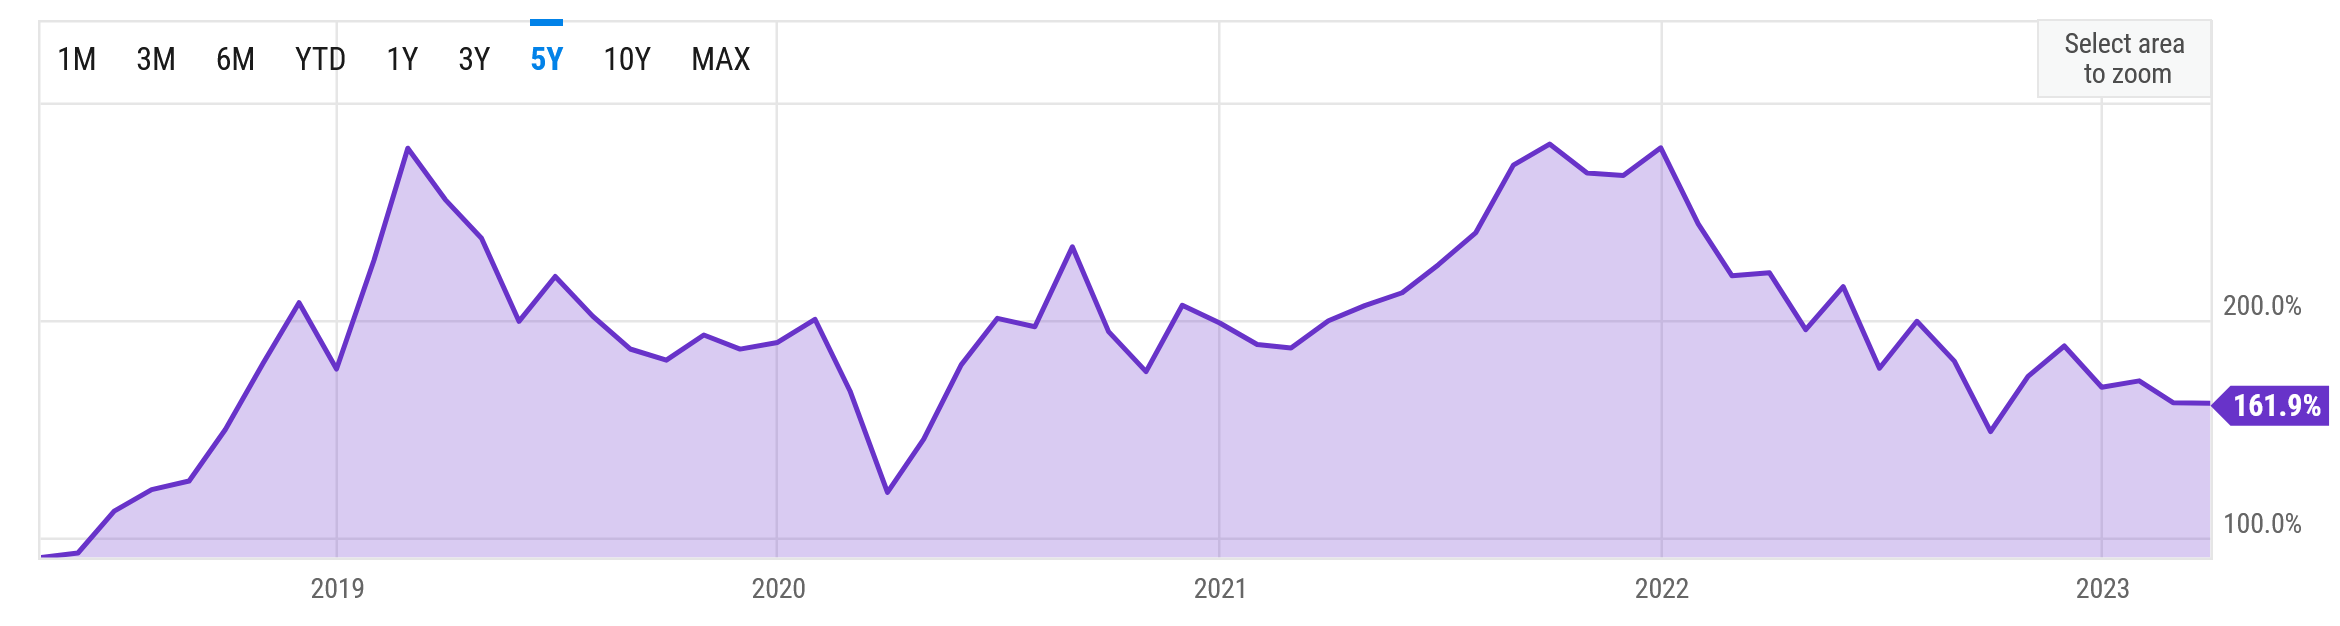
Source: Y-charts
To see the effect of market timing in action, look at the above graph, and focus on the right half. You’ll see a large peak right at the beginning of 2022, placing the 10-year return at almost 300%. So, what happened end of 2021 and early 2022 to cause this sudden plummet?
Well, a lot, actually:
- For starters, Russia attacked Ukraine, crippling supply chains around the world.
- Americans came out of quarantine to find the Fed grappling with raging inflation by raising interest rates, and rising interest rates tend to hurt over-leveraged companies.
- There were also looming concerns about China’s economy.
And the big problem was that these events, these outliers, were unpredictable. Granted, the rising tensions between Russia and Ukraine might have raised the alarm, but we still were never 100% sure whether Russia would pull the trigger or not. Similarly, while we can all speculate over whether the Fed or the central bank will raise interest rates, we are never certain until it happens.
All this is to say that timing the market effectively is almost impossible.
So, if you can’t time the market, then what should you do?
How Can You Make the Most Out of Passive Investment?
The good news is that even in a volatile market where the effectiveness of an active strategy is questionable, there is plenty that you can do as a passive investor.
1. Remember That Time Is On Your Side
If there is one thing you take away from this piece, then let it be this: Buy and hold your investment for as long as you can because time is always on your side.
On the one hand, the longer your investment time horizon is, the more likely the market fluctuations will even out, netting you the expected annual rate of return we talked about.
On the other hand, when you leave your money invested for a long period of time, you are letting compounding work its magic. To drive the point home, I want you to go over the above tables again and notice that while the 30-year S&P return was a respectable 1596.3%, the 50-year S&P 500 return was a stunning 13,964.77%.
2. The Market Will Fluctuate
Having just highlighted the importance of staying in the market for a few decades at least, we need to talk about how you can handle the inevitable ups and downs that come with investing.
Anytime something happens in the market, your first instinct might be to try getting ahead of it, such as exiting when the market seems that it is about to plunge. However, following these instincts might do you more harm than good.
To begin with, we just mentioned that timing the market is nearly impossible for the expert investor, let alone for the average Joe. And, to make matters worse, your margin of error is slim to non-existent.
Missing just 10 days out of the past 15 years would have been enough to wipe out more than half of your profits during that 15-year period.
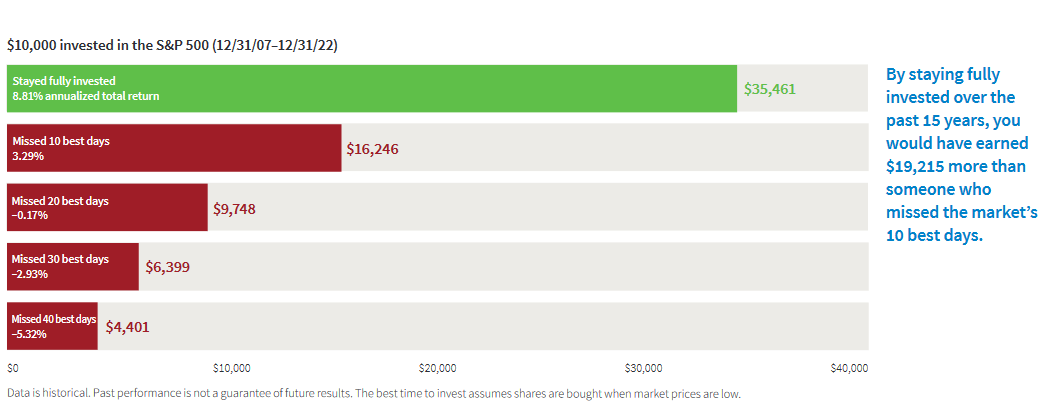
Source: Putnam Investments
I want you to take a second and really try to appreciate what the above graph is trying to say. If you had missed only 10 days out of the past 15 years, your cumulative return on investment for those 15 years would have been around one-quarter of the returns enjoyed by someone who had left their money in the market for the entire period. That’s a margin of error smaller than 0.2%
And, if you had missed the 20 best days of the market, you would have ended up losing money after those 15 years.
So, you want to think of the market like a wave that goes up and down, and your job is to ride both the crests and troughs of that wave. When the market is doing well, remember that this is only temporary, and don’t get too excited. When the market is going down, don’t sell your assets, and be patient.
Putting It All Together…
On average, the stock market will give you an average annual return rate of 10%, which becomes closer to 6-7% when you account for inflation. However, you can’t enjoy these rates of return unless you are willing to stay invested for the long haul and stick out the bad times. In short, you need to develop a time horizon of decades, not years.
And, if you ever doubt the power of compounding over time, just remember that Warren Buffet made 90% of his wealth after turning 60, which is the same 90% that will find its way into the S&P 500 when the Oracle of Omaha is no longer with us!