

Healthcare spending is a major challenge for the US economy. The U.S. health system is the world’s most expensive and faces challenges in providing affordable care, leading to financial stress and debt for many Americans.
These U.S. healthcare spending statistics help us understand the dimensions of this problem.
Key Takeaways
- The United States spent $4.5 trillion on healthcare in total in 2022, with 2023 spending estimated at $4.7 trillion.
- The US spends around $13,493 a year per person on healthcare, more than double the OECD average of $4986.
- Canada spends $6,236 less per person on healthcare each year than the US.
- People 65 and older account for 18% of the population but 36% of healthcare spending.
- Working-age women spend 20% more on healthcare per year than working-age men do on average.
- Prescription drug spending increased 8.4% in 2022, after a 6.8% increase in 2021.
- Insured individuals paid $8,435 on average for a single policy in 2023.
- The amount of medical debt in the US is estimated to be anywhere from $88 billion to $220 billion.
- 63% of people said they had to cut back on food and basic necessities to stay on top of their medical bills.
How Much Does the US Spend on Healthcare?
The U.S. spent $4.5 trillion on health care in 2022, a $400 billion increase over 2020. Spending increased despite the reduced impact of COVID-19. 2023 spending is estimated at $4.7 trillion[1].
For perspective, that’s about 17.3% of the US Gross Domestic Product (GDP) and almost 5 times the annual defense budget.
Average Cost of Healthcare per Person
The US spends around $13,493 a year per person on healthcare, the highest average cost of healthcare in the world. That figure is up from $10,242 in 2016[1].
To put the numbers in perspective, Canada spends $6,438 per person on healthcare, or $7,055 less per person than the US.
How Much Does the US Spend on Healthcare Compared to Other Countries
The U.S. spent an average of $13,493 per person on healthcare in 2022. Switzerland falls a distant second with an average of $8,049 per person per year[2].
Healthcare Spending by State, Age, and Gender
Per Capita Healthcare Spending by State
We were unable to determine the exact per capita healthcare expenditures per state. This is why we calculated the average healthcare spending per capita by state using the data on total personal healthcare spending. New York has the highest per-capita healthcare expenditure, with $14,007[3].
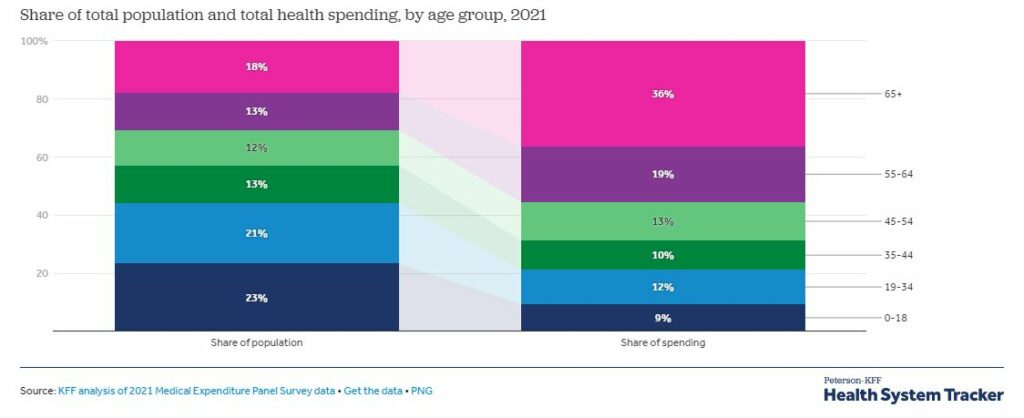
Healthcare Spending by Age
The 0-18 age group accounts for 23% of the population but only 9% of all healthcare spending. The 65+ age group contains 18% of the population but accounts for 36% of healthcare spending. People over 55 account for over 50% of healthcare spending, which is expected: as we grow older, we require more care[4].
Healthcare Spending by Gender
Women spend more money on healthcare than men, but the distribution changes with age. In the 18 and under bracket spending was substantially less for girls, as boys have higher rates of accidents. In the 65+ age bracket, men also spent more than women. From 18 to 54, however, women spent substantially more, attributable largely to childbirth and reproductive health care[4].
Concentration of Healthcare Spending
A relatively small number of people – often those with chronic health problems – accounts for a large percentage of US healthcare spending. 1% of the population accounts for 24% of healthcare spending, and the top 5% of spenders account for over 50%. The healthiest 50% of the population accounts for only 3% of annual healthcare spending[4].
How Is Healthcare Financed
Most healthcare in the US is financed by private insurance companies, government programs like Medicare and Medicaid, and out-of-pocket expenses carried directly by the patient. Here’s how the balance among those payers has evolved[5].
Who Pays For Healthcare?
Data from the US Government’s Centers for Medicare and Medicaid Services (CMS) shows that 29% of costs related to health care in 2022 were covered by private health insurance and 21% by Medicare[5].
Healthcare Spending By Type of Expenditure
CMS data show that hospital expenditures accounted for the largest share of spending, at $1,355 billion. Physician and clinical services spending was second, at $884.9 billion. Prescription drug spending was $405 billion, an 8.4% increase over 2021[5].
Health Insurance Statistics
70% of private industry American workers had access to employer-sponsored health insurance in March 2022, and approximately 66% were using that insurance. The percentage of workers with access to employer-sponsored health insurance varies with the income level of the workers: the higher the income, the more likely workers are to be offered health insurance by their employers[6].
Who Pays for Employer-Provided Private Health Insurance?
The cost of employer-provided private health insurance is typically shared between the employer and the employee. The employer pays a portion of the cost as part of the employee’s compensation package.
On average, employers pay 67% of the cost and employees pay 33%, but this also varies with the income level of the worker. Low-wage workers typically pay a higher percentage of the cost of health insurance[6].
How Much Does Employer-Sponsored Health Insurance Cost?
The average cost of employer-sponsored health insurance in 2023 was $8,435 for single coverage and $23,968 for family coverage. There is some variation with the size of the company: larger companies have more bargaining power when dealing with insurers and typically have lower premiums and better benefits[7].
Following the average division between employer payment and employee payment, the employee’s share of the average policy would be $2783 for a single policy and $7909.44 for a family policy.
These averages conceal a considerable variation in insurance premiums. Policies for 9% of workers cost under $5000/year, while those for 11% of workers cost over $11,000 per year[7].
The cost of health insurance has increased dramatically over the last two decades. In 1999 the average cost of a single employer-sponsored health insurance policy was $2,196, less than a third of the current cost[7].
Health Insurance Costs and Wage Stagnation: An Overlooked Connection
Many workers see employer-sponsored insurance as a great deal because the employer carries 2/3 of the cost. From the company’s perspective, though, this cost is part of the worker’s compensation package. One of the reasons for wage stagnation is that the value of non-wage compensation – primarily in the form of health insurance – has increased so dramatically.
Employers have tried to limit health insurance cost increases by raising the deductible: the amount of money the worker must pay before insurance coverage begins. Small firms with limited bargaining power are particularly likely to have high deductibles. The percentage of policies with deductibles over $2000 has surged over the last 15 years[8].
High deductibles are a significant cause of medical debt. With 78% of Americans living paycheck to paycheck, many have to take on debt even if they have employer-sponsored coverage[9].
Medical Debt Statistics
How Much Medical Debt Is There in the US?
Medical debt is difficult to quantify, because many people pay for medical services with consumer loans or credit cards, or borrow money from family members. Many statistics overlook these debts and count only debts that are owed directly to medical providers. One analysis, by the Peterson-KFF Health Systems Tracker, estimates that as many as 41% of American adults have some form of medical debt[10].
A US Census Bureau focusing only on debts over $250 owed to medical providers found that 20 million Americans have such debts and that the total amount owed is around $220 billion. 6% of American adults owe over $1000 and 1% (3 million people) owe over $10,000[10].
Predictably, people in poor health and people with disabilities carry high levels of medical debt. They are also those least likely to be able to pay it.
Black Americans, women, and people of working age also owe high levels of medical debt.
Only 1% of the population owe over $10,000 in medical debt, but those debts account for 78% of the total outstanding debt[10].
Medical debt varies widely by state, with a concentration in the South, where incomes are low, poverty rates are high, and many states have not adopted expanded Medicaid services. South Dakota has the highest percentage of individuals with medical debt, at 17.7%, followed by Mississippi with 15.2%. The percentage is lowest in Hawaii (2.3%) and Washington DC (2.7%)[10].
Many people with medical debt have postponed or skipped needed healthcare due to costs, which can further endanger their health[11].
How Do People Tackle Medical Debt?
Healthcare services are quite costly in the U.S., and not all of the cost is covered by insurance. Many Americans, even those with insurance, fall into debt because of their high hospital bills.
A survey designed to reveal how Americans manage medical debt found that 63% of those surveyed said they had to cut back on food and necessities to stay on top of their bills, while 48% used up all of their savings to pay off the debt. Unfortunately, some have been put in situations where they filed for bankruptcy, asked for charity aid, or lost their home.[12]