
Stock charting software are powerful tools that can help you visually represents stock market data. These tools provide comprehensive visual representations of stock data, helping traders and investors analyze trends, patterns, and indicators with ease.
Best Stock Charting Software
✍️ Note: Some of these charting packages are integrated with trading platforms. If you’re looking for a broker that offers advanced charting capabilities, consider these. If you have a broker and are looking for an analysis tool, consider stand-alone charting software.
#1
TradingView
TradingView is an impressive piece of charting software. Its charts are more modifiable than most, and it has an amazing array of indicators, algorithms, chart types, and anything else you might want. The only downside is that you need to pay to access the best features, but it’s priced reasonably enough that it’s worth a look for anyone even somewhat interested in charting.
TradingView is a stand-alone charting and research platform. Read more
#2
Thinkorswim
Thinkorswim is TD Ameritrade’s proprietary platform. It’s free to use, full of features, and lets you buy and sell within the interface without having to connect to any other services. It’s streamlined, versatile, powerful, and worth a look, at the very least.
Thinkorswim is integrated with the TD Ameritrade trading platform. Read more
#3
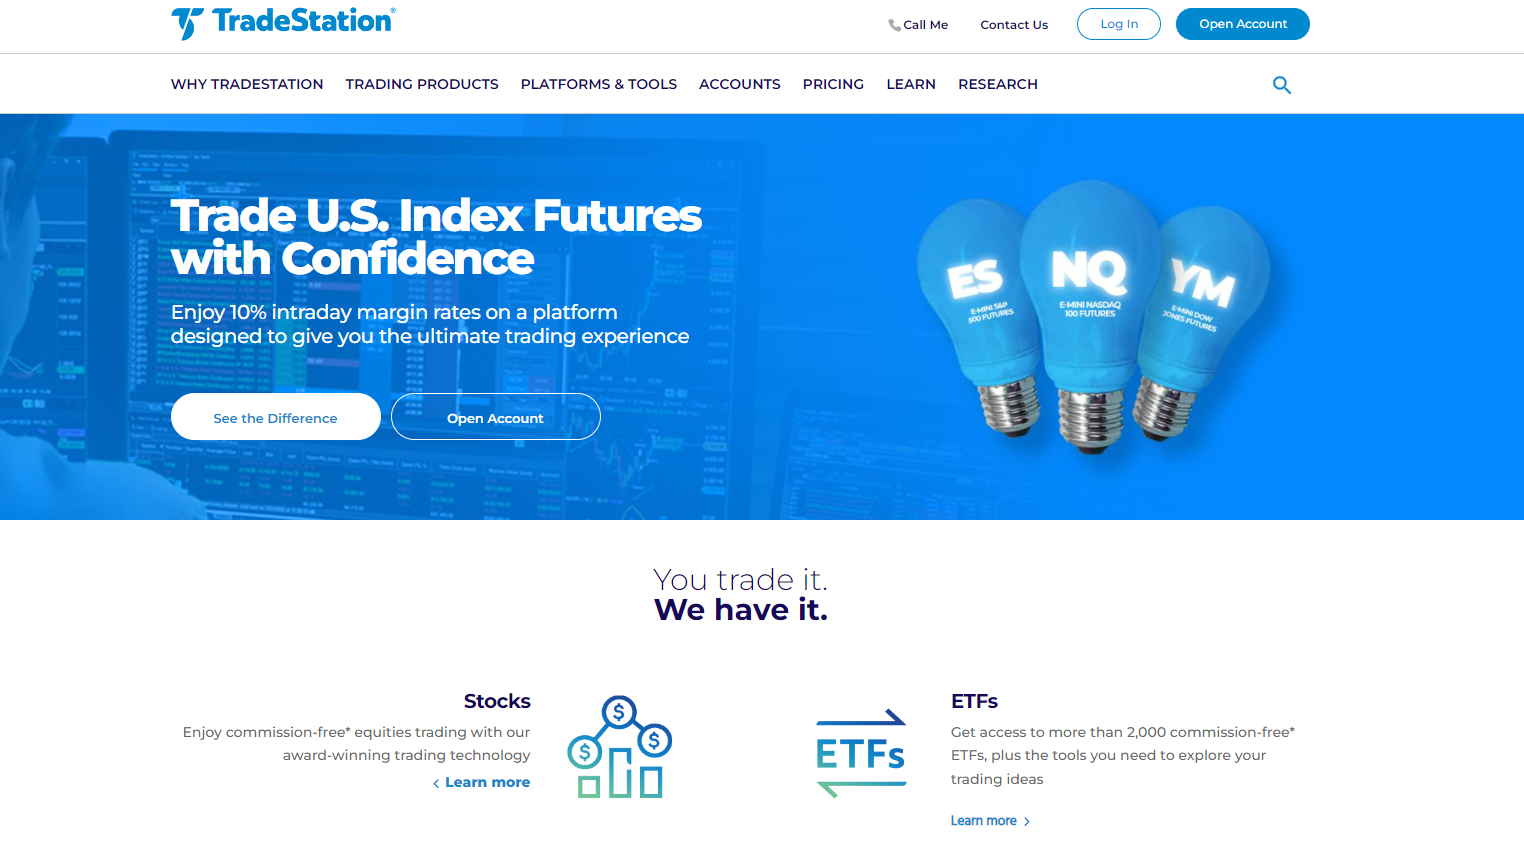
TradeStation
This downloadable software will set you back a few bucks, but it’s hard to beat the level of customizability that its EasyLanguage code offers to the computer savvy. Its charting features run incredibly deep, perfect for doing technical analysis from any angle you can imagine.
TradeStation is an integrated trading platform with advanced charting capabilities. Read more
#4
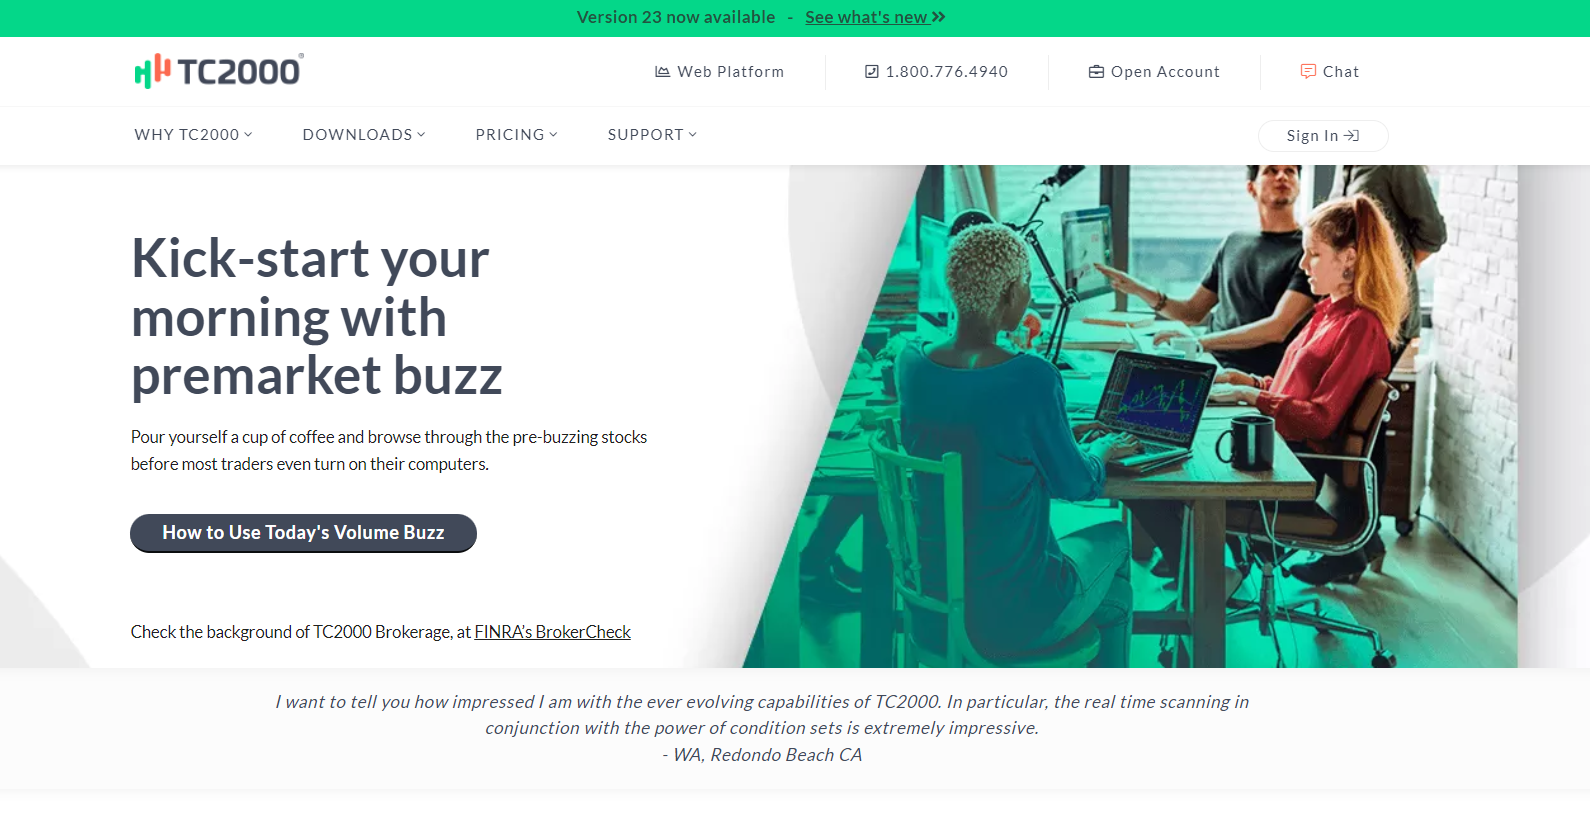
TC2000
This software isn’t as easy on the eyes as some others, but it comes from a venerable company that’s had over two decades to perfect its product. You’ll find an amazing range of charting features, technical indicators, analytical features, and anything else you’ll need to find and seize the trading opportunities you’ve been looking for.
TC2000 is a trading platform with charting capabilities. Read more
#5
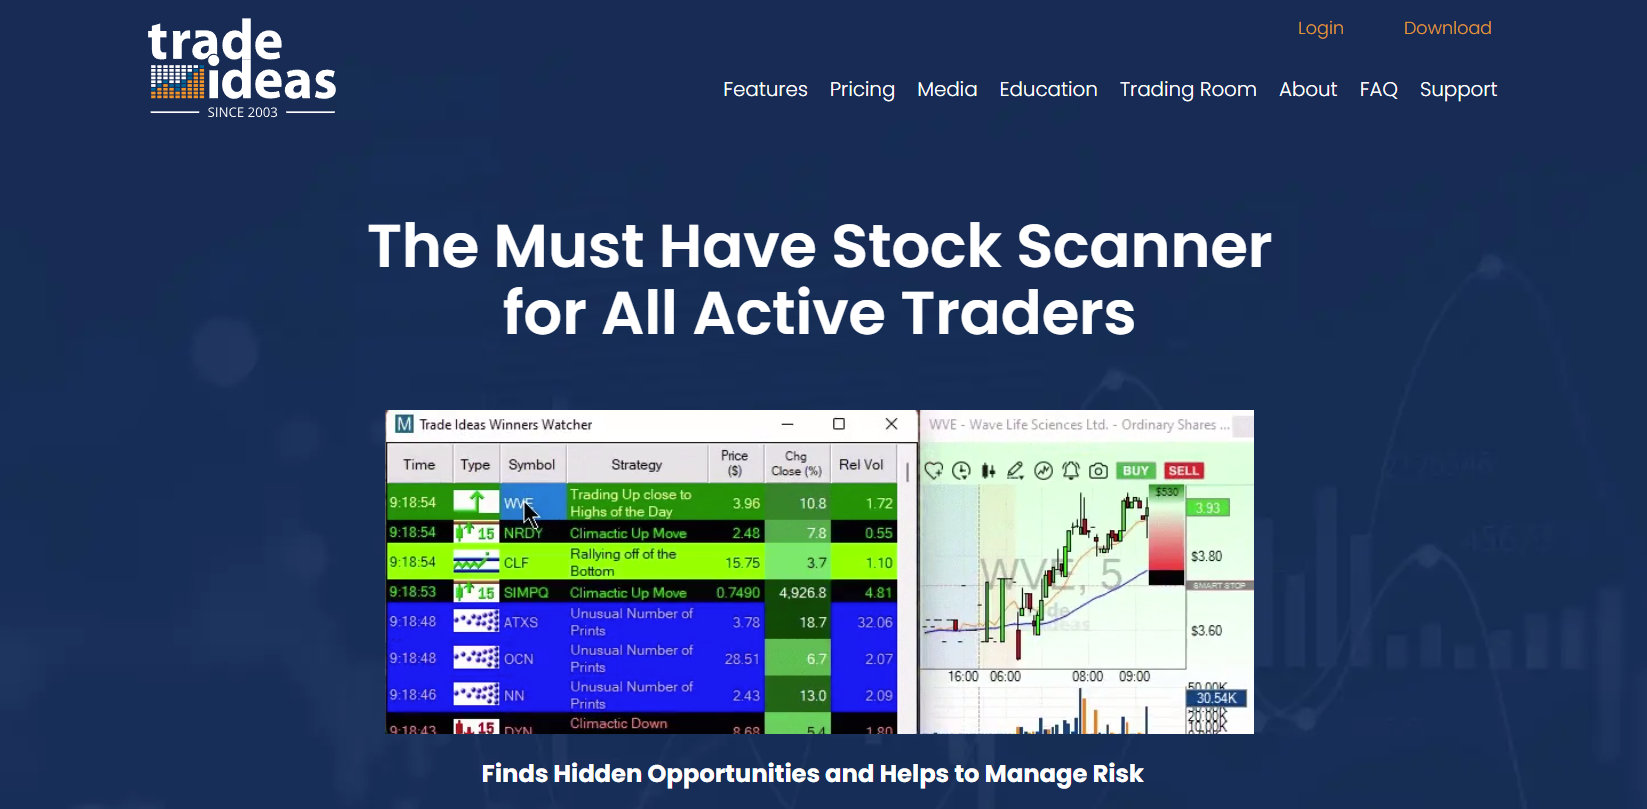
Trade Ideas
This AI-driven software puts the power of the future in your hands. Holly, your AI, runs millions of simulations and backtests every night to identify trading opportunities and generate buy/sell signals, and it comes equipped with the ability to run, analyze, and optimize simulations based on all of your trade ideas. It’s expensive, but it may be worth the price.
Trade Ideas is a stand-alone analysis tool. Read more
#6
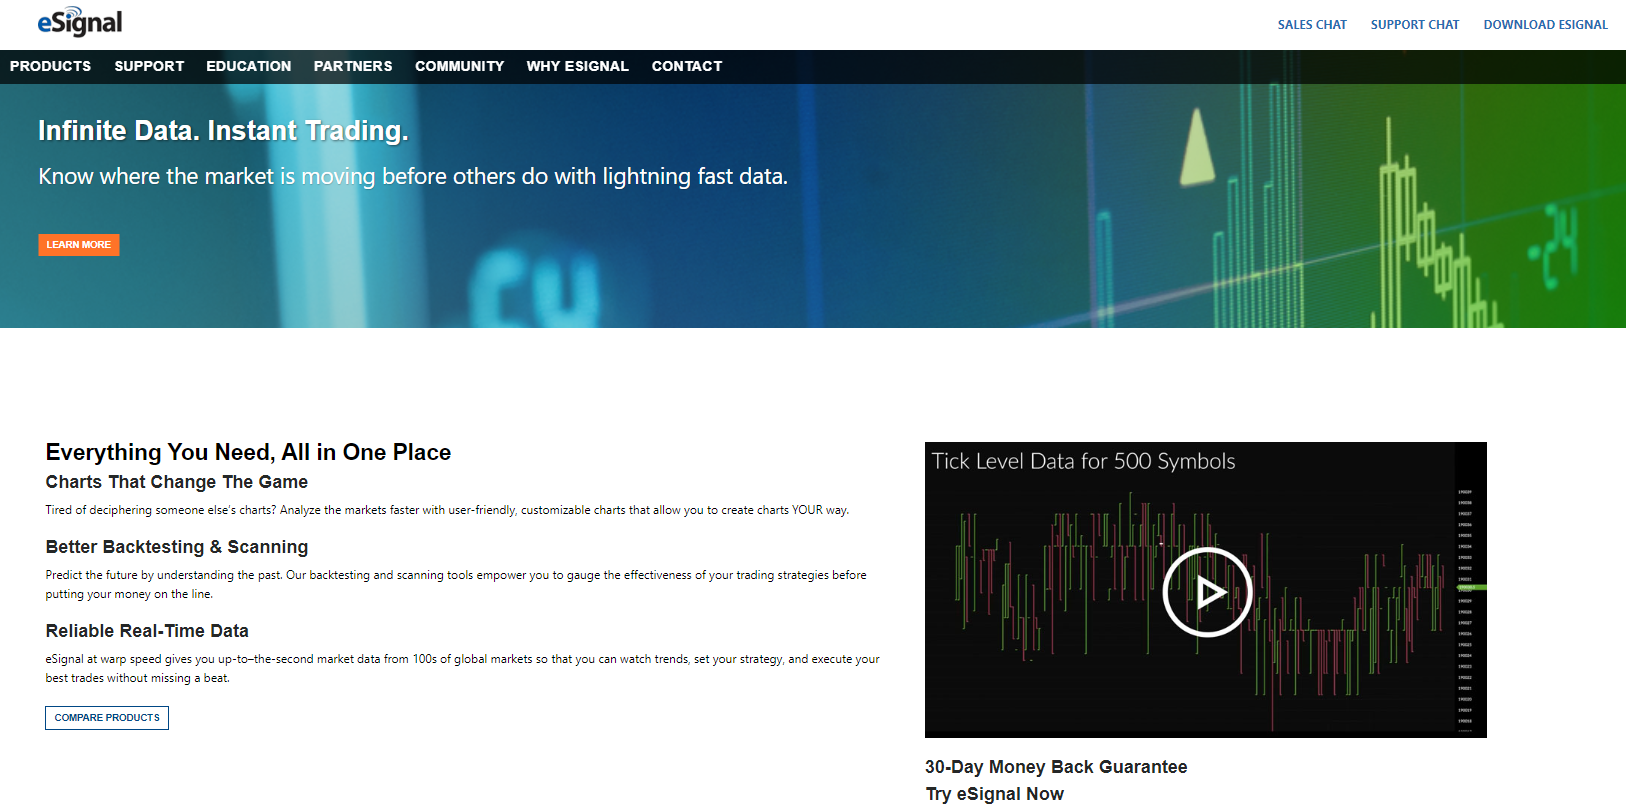
eSignal
eSignal may have some of the most impressive charting features on the market. In addition to the staggering array of drawing tools, indicators, and chart types, it lets you click on and adjust almost every aspect of every chart you open. You can connect charts together, set custom intervals, and do pretty much anything else you can imagine with eSignal’s charts.
eSignal is a stand-alone charting and analysis package. Read more
#7
MetaStock
This downloadable software takes a little while to get the hang of, but it’s powerful and flexible enough to be worth climbing the learning curve. Its set of built-in tools will help you scan, analyze, and identify all the best trading opportunities, and it gives you the power to create your own tools for a truly custom investing experience.
MetaSock is a charting and research package that you would use alongside your brokerage platform. Read more
The Best Charting Software
There are plenty of different investing programs, websites, and apps on the market, and all of them promise that they do what they do best. Having all those different choices is nice, but it’s not easy to sift through all the options to find the ones that really work for you. Thankfully, we’re here to take that off your plate and make your choice nice and easy.
Keep reading for our recommendations on the best stock charting software out there.
1. TradingView
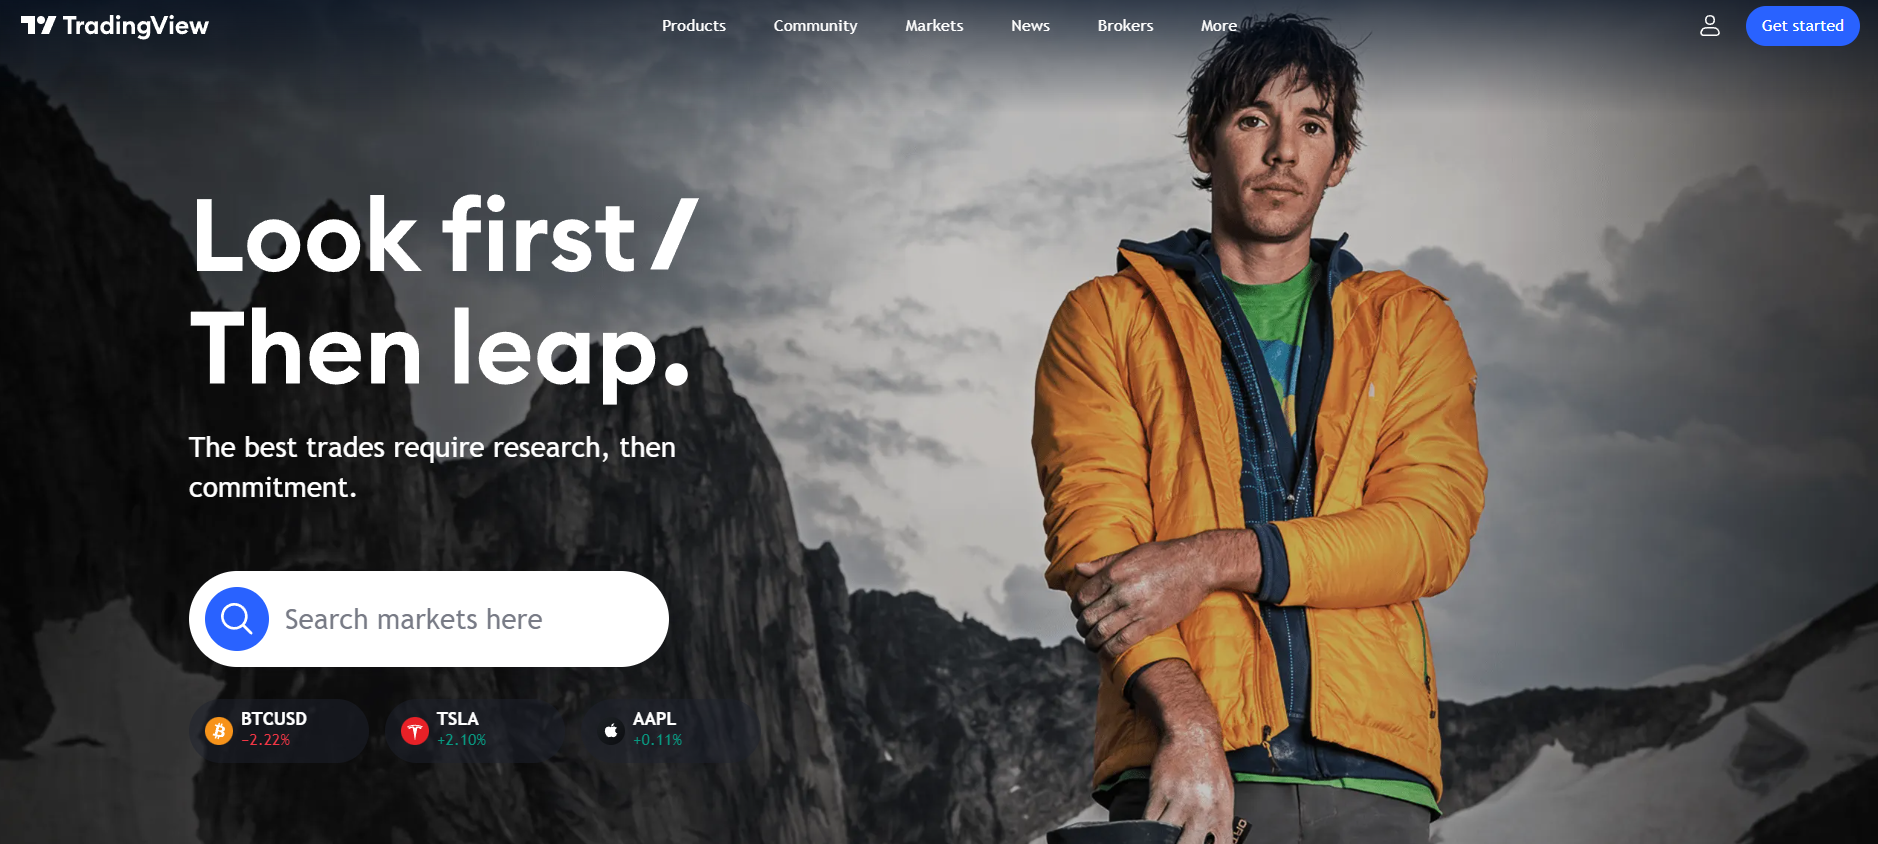
TradingView is a beast among charting applications. Custom intervals, scales, chart types, indicators, modifiable scripts—it’s almost insane how much this application can do.
You get over 100 technical indicators to play with right off the jump on top of the over 100,000 indicators made by other members of the community. There are over 50 drawing tools you can use to mark up any chart, plus pattern-recognition algorithms, Fibonacci retracements, multi-timeframe analyses, and way, way more. It’s hard even to explain how much this software can do.
TradingView has a great free version available, though you’ll want to sign up for Pro or Premium to access everything it has to offer. Thankfully, even the Premium tier isn’t all that expensive compared to some of the pricier services out there.
💵 Price:
- Free tier available
- 30 day free trial
- 🥈 Pro:
- $14.95/month
- 🥇 Pro+:
- $29.95/month
- 👑 Premium:
- $59.95/month
➕ Pros:
- An amazing array of features
- Endless options for custom analysis
- The free version has a lot of features.
➖ Cons:
- Best features are locked behind a paywall
2. Thinkorswim
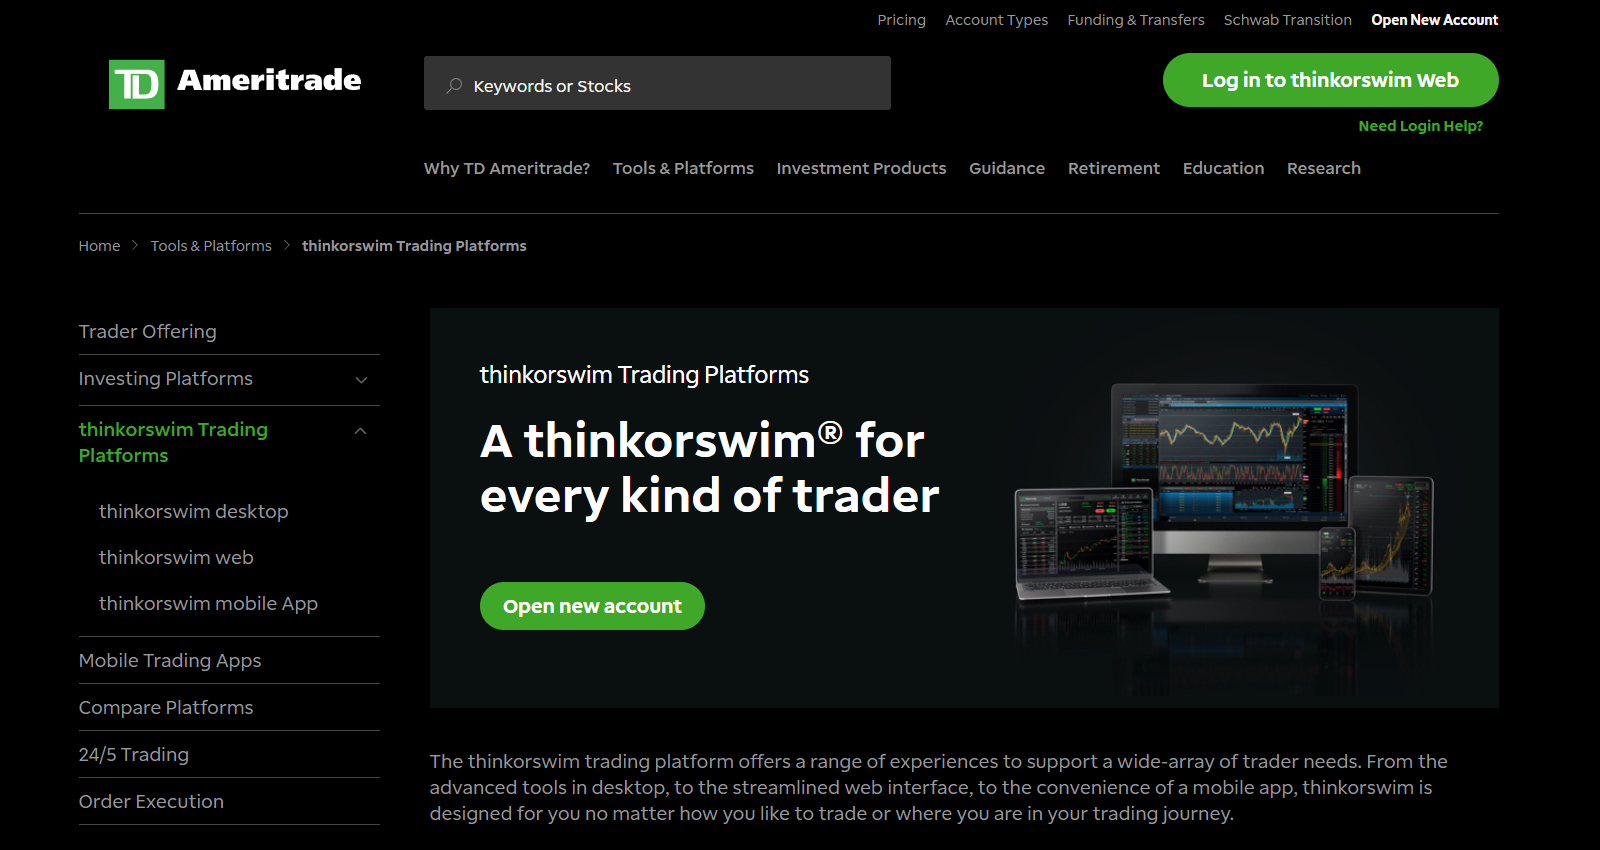
Thinkorswim is TD Ameritrade’s proprietary trading platform. It’s available as a downloadable program, a smartphone app, and on your web browser. Each version has its own strengths, but you’re really going to want to go for the desktop version for the most complete experience.
In addition to letting you trade everything from equities and ETFs to options and futures, thinkorswim comes equipped with an incredible array of charting and analytical tools. You can add over 400 different technical indicators to any chart, swap out the lines for candles or monkey bars, draw your own lines and curves, and even use eight different Fibonacci tools to identify trends and price signals.
As if that weren’t enough, thinkorswim provides all the economic data points you need to develop your own custom indicators and apply them to your charts to help further with spotting trends in the data. If you want even more customization, you can use the thinkScript feature to create your own analytics and algorithms using its built-in tool or by writing your own object-based code.
💵 Pricing:
➕ Pros:
- Brokerage integration
- Free/low commissions
- Over 400 technical indicators
➖ Cons:
- Fee structure is somewhat opaque
3. TradeStation
If you like the idea of coding your own indicators and trading strategies, TradeStation’s Desktop 10 platform might be just what you’re looking for. Almost all of the built-in analysis techniques, indicators, and strategies are written in TradeStation’s proprietary EasyLanguage computer language, and the platform is flexible enough that you can edit or upgrade any of them with just a few lines of code.
The code itself is pretty easy to learn, and once you have a grasp on it, the possibilities for creating new indicators and sculpting new strategies are almost limitless. You can create and backtest strategies, optimize and automate trade ideas, and run any number of simulations to get a sense of how your trades might turn out.
That said, you don’t need to learn how to code to get a ton of value out of TradeStation’s charting features. Its RadarScreen feature lets you monitor hundreds of companies, cryptocurrencies, indices, and futures in real-time, for one, and you can pull up charts for any one of them at a moment’s notice. You can add built-in or custom technical indicators, customize any of the chart’s parameters, and use drawing tools to identify patterns—and that’s barely scratching the surface.
💵 Pricing:
➕ Pros:
- EasyLanguage coding offers incredible potential for custom indicators and strategies
- RadarScreen feature is one of the better stock screeners
- Impressive variety of technical indicators and drawing tools
➖ Cons:
- Need to learn EasyLanguage to get the most out of the software
4. TC2000
TC2000 is a polished charting software that you can download, access via a browser, or use on your phone. The software hit the market over 25 years ago, and since then, it’s made a name for itself as a trading platform with some of the best charting features in the game. Don’t let its slightly dated look fool you; TC2000 more than makes up for its comparatively plain presentation with a whole host of incredibly deep features.
If you’re at all interested in stock and/or options trading, you should at least check out TC2000’s free trial versions. You’ll get to access a ton of delayed streaming data, an in-depth trade and strategy simulation feature, the ability to link up to your brokerage for in-program trading, and, of course, the charting feature.
TC2000 has all the standard charting stuff like technical indicators, adjustable parameters, and so on. The real appeal, however, comes from the ability to plot data like option/stock relationships and bid/ask data, plus the ability to trade multi-leg options strategies right from the chart. There aren’t many platforms out there that’ll visualize the profit, loss, strike prices, and expiration dates with dynamic, color-coded zones that show you potential upside and downside at a glance.
💵 Pricing:
- 🥈 Silver:
- $9.99/month
- $99.84/year prepaid
- $179.76/two-year prepaid
- 🥇 Gold:
- $29.99/month
- $299.88/year prepaid
- $539.76/two-year prepaid
- 👑 Platinum:
- $59.99/month
- $599.98/year prepaid
- $1,079.76/two-year prepaid
➕ Pros:
- Advanced options and stock charting
- Sterling reputation
- In-depth strategy simulations
➖ Cons:
- Pricey
- Visually unimpressive interface
5. Trade Ideas
Artificial intelligence is poised to change the way we do just about everything, so why not harness the power of AI to make more money? Trade Ideas has a built-in AI named Holly that runs millions of scans and trading scenarios to identify potential opportunities, automatically finds ways to optimize your portfolio, and can even be directed to buy and sell equities based on your desired parameters automatically.
Trade Ideas has a robust set of charting features, though you’ll probably be leaning more on Holly’s recommendations than your own technical analysis skills. Holly will help you run scans to find the stocks that fit your criteria, backtest your scans, evaluate results, and automatically suggest which parameters you can change to get better results. On top of that, Holly will also jump into any chart for any stock you’re looking at and suggest both data-supported entry points and exit signals, giving you a sense of what the data is pointing towards on any given day.
Finally, Trade Ideas’ simulated trading system puts the power of AI in your hands, letting you generate and play out any number of simulated trades and trading strategies. All of the results are recorded, analyzed, and optimized based on Holly’s recommendations.
💵 Pricing:
- 🥈 Standard:
- $118/monthly
- $999/year prepaid
- 🥇 Premium:
- $228/month
- $1,999/year prepaid
➕ Pros:
- AI integration
- Advanced simulation capabilities
- Automated buy/sell recommendations
➖ Cons:
- Takes a while to learn
- Giving up some degree of control to AI
- Expensive
6. eSignal
eSignal’s downloadable software is its own investing information ecosystem. Though it is a bit on the pricey side, it’s hard to find a platform that has anywhere near the kind of charting features that even eSignal’s basic membership offers. If you sign up, you’ll get access to streaming intraday data (with real-time data available at higher tiers) on stocks, forex, and futures, plus the ability to twist, change, compare, adjust, and cross-check the charts of just about every one of them.
The chart window is home to some of eSignal’s most impressive features. Almost every piece of every chart is clickable and editable, right down to the candles and lines themselves. You can easily create a chart based on any available symbol, insert your desired interval, set data ranges, choose between chart styles, and even link two or more charts together by symbol or interval.
eSignal’s chart studies feature lets you apply hundreds of different technical studies, formulas, or add-on studies to any chart you choose. And if you want to really customize your analysis, you can create your own studies by writing them in the EFS scripting language editor or use the built-in drawing tools to add things like trend lines, regression trends, and more.
💵 Pricing:
- 🥈 Classic:
- $61/month
- $612/year prepaid
- 🥇 Signature:
- $204/month
- $1,860/year prepaid
- 👑 Elite:
- $416/month
- $4,020/year prepaid
➕ Pros:
- Incredibly versatile charts
- Ability to create custom studies using ESF language
- Automatic options upside/downside calculations
➖ Cons:
- On the expensive side
- Relatively steep learning curve
7. MetaStock
MetaStock has been producing charting and analysis software for over 30 years, and they’ve gotten pretty darn good at what they do. The downloadable software combines powerful screeners, data streams, charting tools, and more to help independent traders get the best returns on stocks, options, futures, and forex.
The software’s functionality stems from prebuilt analytical modules called PowerTools. You can use these to perform scans to find securities based on specific criteria, backtest multiple strategies at once, get automated buy and sell signals, and find data-backed predictions of prices and market movements. The software comes with a set of prebuilt PowerTools, but you aren’t limited to prefabricated solutions. If you feel like any of the prebuilt tools are lacking, you can easily create your own custom set of tools for a truly bespoke analytical experience.
Almost everything you do in MetaStock can be charted, analyzed, and compared against a long list of technical indicators. You can generate heat maps of past or potential trades, visualize suggested buy and sell signals on a number of different chart types, and even employ techniques that you can’t find elsewhere, like the Rahul Mohindar Oscillator (RMO) strategy.
💵 Pricing:
- 30-Day Free Trial
- Pricing List
➕ Pros:
- Impressive charting features
- Custom tool creation and tweaking
- PowerTools offer a lot of great built-in functionality
➖ Cons:
- Opaque pricing structure
- Antiquated interface
Compare Stock Charting Software
In the table below we compare the key features and functionalities of all stock charting software options so you can choose the ideal solution for your investment needs.
| Customizability | Range of Indicators | Supplemental Tools | Ease of Use | |
|---|---|---|---|---|
| TradingView | Almost endless options for chart customization | All the indicators, chart types, custom scripts, etc. that you could want | Screeners, algorithms, alerts, custom scripted indicators, heat maps, economic calendars | Sharp learning curve due to sheer number of options |
| Thinkorswim | Semi-customizable charts | Over 400 technical indicators | Research, screeners, integrated trading | Fairly user friendly |
| TradeStation | Extensive customizability and custom coding | Built-in and custom indicators | RadarScreen screener tool, research, analytics | Need to code to reach max potential |
| TC2000 | Highly customizable charts | Wide range of indicators | Options charting, screeners, simulations | Old-fashioned design and interface |
| Trade Ideas | Mostly prebuilt functionality | Not as many as other services | AI assisted analysis, simulations, backtesting | Decent learning curve |
| eSignal | Incredibly customizable charts | Hundreds of technical studies and formulas | Real-time data, research, custom-coded features | Steep learning curve |
| MetaStock | Highly customizable charts, interface, strategies | Long list of indicators, heat maps, chart types | PowerTools offer screening, planning, backtesting, and other features | Moderate learning curve |
How We Selected These Tools
We picked these stock charting tools based on a few different criteria:
- Price
- Charting Features
- Versatility
- Unique Features
Pricing:
This one’s easy enough to explain. A lot of services like these charge more than a lot of independent investors can swing, so we tried our best to limit the selection to services that had free trials, free memberships, and relatively reasonable pricing structures.
Charting Features:
This is an article about charting software, so naturally, we tried to find the software and platforms that had the most robust charting features we could find. The vast majority of investing software, apps, and web-based platforms have some kind of charting features, but not all of them give you the ability to buy stocks right from the chart, connect charts, apply technical indicators, create your own technical indicators, change the chart type, and so on. The more the charts can do, the better.
Versatility:
A charting software wouldn’t be much good if charting was its only feature. We focused primarily on charts for this piece, but that doesn’t mean we only focused on them. The more features outside of charting that service had, the more it factored into our consideration. We like to see things like brokerage connections/in-software trading, research and analytical features, stock screeners, historical data, community features, and anything else that might add value to the proposition.
Unique Features:
This one’s a little less tangible than the other features. Almost every one of the services listed has something going for them that none of the others do. Think things like Trade Ideas’ AI integration or thinkorswim’s symbiotic relationship with TD Ameritrade. This wasn’t the biggest factor in deciding what to pick, though it certainly earned some entries a few bonus points.