Over 88% of Survey Respondents Report a Significant Impact on Household Budget
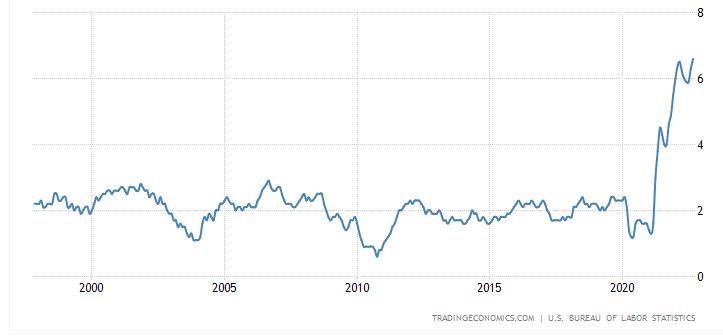
We almost forgot about inflation. For over 25 years the annual increase in the Consumer Price Index has been below historical averages. For most of that time, inflation has held near or below 2% a year, a barely noticeable level.
Those days are gone. 2022 has seen inflation soar to levels unseen since the 1980s, as pandemic-driven supply chain crunches and Russia’s war on Ukraine combine to hold the supply of goods well below soaring post-pandemic demand.
The Federal Reserve’s response has been to push interest rates up, a conventional anti-inflation measure that has only increased the stress on consumers who have resorted to loans and credit cards to make ends meet as prices outstrip wages.
The response of consumers – many of whom are dealing with high inflation for the first time in their adult lives – has been more diverse. We wanted to know more about how Americans are coping with inflation, so we designed a survey to find out.
Key Findings
- Over 88% of respondents stated that inflation has had a moderate, high, or very high impact on their family budgets.
- The restaurant business is likely to take a hit: over 65% of respondents said they were cutting back on eating out…
- Other major targets for spending reduction include apparel, groceries, and groceries.
- Over a third of respondents are committing less money to savings.
- 30% of respondents reported working more hours to keep up, and 28.86% have sold personal items to make money. 23.18% have delayed paying debts.
- 53.78% have taken on additional debt, with 27.89% reporting that they have put more money on their credit cards.
- Even respondents with incomes over $150,000 a year reported significant changes to spending, borrowing, and investing habits.
Survey: The Impact of Inflation on the American Budget
How has inflation affected the personal finances of American households? Let’s take a closer look.
How Big of an Impact Have Rising Prices Had on Your Household Budget Over the Last Six Months?
Over 88% of respondents stated that inflation has had a moderate, high, or very high impact on their family budgets. 48.93% said the impact was “high” or “very high”, and 39.48 said “moderate”.
Respondents aged 18-29 were most likely to report a “moderate” impact, at 48.46%, and least likely to report a “very high” impact, at 14.51%. Responses across other age groups were extremely consistent.
Variations across income levels were relatively low. Respondents earning over $150,000/ year were most likely to report a “moderate” impact (43.79%) and least likely to report a “high” or “very high” impact (34.64% combined), while those earning under $50,000/year saw 36.87% reporting a “moderate” impact and “high” and “very high” combining for 54.55%.
That disparity is expected, and the main surprise is that it isn’t larger.
Which of the Following Expenses Have You Cut in the Past Six Months to Save Money?
Almost all respondents reported cutting expenses, with only 8.01% saying that they did not.
The runaway leader in this category was dining out, cited by almost ⅔ of the respondents. That is expected, as it’s a minor sacrifice to make for most individuals, but it’s not a positive sign for the restaurant industry and its suppliers.
Apparel, Groceries, and Travel/Vacations were close behind, each cited by between 44% and 49% as a target for spending cuts. Gas (33.44%) and savings (34.8%) were one tier down.
Recreation, charitable giving, and cosmetics and personal care items were all selected by between 27% and 30% of respondents, while 20.53% reported placing less money into investments.
Relatively small numbers – less than 20% – reported cutting back on utilities, medical care, education, and insurance.
These responses were remarkably consistent across age and income brackets. Younger respondents and those earning less than $50,000/year were most likely to be cutting back on essentials like gas and groceries, presumably because there is less discretionary spending for them to reduce.
Individuals earning over $100,000/year are most likely to be reducing investments, most likely because they are the ones most likely to be making investments in the first place.
Those earning below $50,000 (36.87%) and from $50,000 to $100,000 (38,45%) are most likely to be cutting savings, which was reported by only 26.14% of those earning over $100,000.
Did You Do Any Of The Following in the Last Six Months?
Here we provided a menu of possible responses to inflation. The most common selections were “worked more hours” (30.41%), “sold personal belongings to make money” (28.86%), and “canceled a trip or vacation” (28.02%).
Another cluster of responses clustered around the 18% to 23% bracket: “delayed paying debt”, “delayed buying a car”, “taken a second job or side hustle”, “stopped investing or invested less”, and “skipped medical appointments”.
“Skipped buying medication”, “skipped paying bills”, and “delayed buying a home” drew fewer responses, between 12% and 13% each. 18.4% selected “none of the above”.
There were largely predictable age-based disparities. People over 60 were least likely to have worked more hours, taken on a side hustle, or delayed buying a home, and 31.41% of that bracket selected “none of the above”. People from 18-44 were most likely to work more hours or take on a side hustle.
Responses like “stopped investing or invested less”, “delayed buying a car”, “canceled a trip or vacation”, “skipped buying medication”, and “skipped medical appointments” showed extremely similar results across all age brackets.
Higher-income individuals were least likely to skip paying bills and most likely to have stopped or slowed down on investing, but apart from that, responses were remarkably consistent across income lines. It might be hard to believe that 30.07% of people earning over $150,000 worked more hours, 33.33% sold personal items to make money, and 22.88% delayed paying debt, but those are the results we got!
Did You Have to Borrow Money or Take Out Credit to Cover Ongoing Expenses in the Past Six Months? If You Did, What Did You Use?
53.8% of respondents reported having to borrow money or put more debt on revolving credit lines to cope with expenses. The most common form of borrowing, cited by 27.89% of respondents, was putting more money on credit cards, followed by borrowing from friends and family at 16.33%.
Smaller numbers of respondents reported using personal loans (12.%), cash advances (10.26%), buy now pay later plans (9.8%), and loans from retirement accounts (9.23%), while 5% or fewer reported using payday loans, title loans, and pawnshops.
Older voters were less likely to lean on credit, with 51.26% of the 45-60 bracket and 58.64% of the over 60 bracket reporting that they had not borrowed, as opposed to only 36% to 37% of the younger respondents. Reliance on credit cards sat between 27% and 32% for all brackets except 60+ (23.56%).
Younger consumers were much more likely to borrow from family and friends.
Respondents across all income brackets leaned on credit cards to an almost identical degree: between 26% and 30%. Lower-income voters, probably including many younger voters, were more likely to rely on loans from family and friends.
People with incomes over $150,000 were most likely to borrow from retirement funds or use personal loans. They also reported by far the highest use of payday loans, at 12.42%. We can’t see any explanation for that!
If You Had to Borrow Money to Cover Ongoing Expenses in the Past Six Months, How Much Did You Borrow In Total?
Most respondents borrowed between $500 and $1000 (12.14%), followed by between $1000 and $2000 (10.52%) and less than $500 (9.68%). Much smaller numbers reported borrowing between $2000 and $5000 (6.52%) and over $5000 (5.68%).
Responses to this question broke down heavily along income lines. Respondents earning under $50,000/year were most likely to have borrowed under $500, those earning $50,000 to $150,000 tended toward $500-$1000, and a majority of those earning over $150,000 borrowed between $2000 and $5000.
The Takeaways
What struck us most about the way Americans are dealing with inflation was how unsustainable most of the responses are. Working more hours and cutting back on expenses are logical responses, but there are only so many hours you can add, and only so many expenses you can cut. Trimming savings leaves even less cushion against unexpected events.
Delaying debt payments and bill payments is not a solution, and it often makes matters worse, leading to falling credit scores, debts in collection, and higher credit costs when people have to borrow again.
A particular concern is the large number of people turning to credit cards as a solution. With interest rates soaring, higher credit card balances are just going to be a bigger drag on budgets, drawing money away from basic necessities.
If inflation continues, consumers will need to adjust further and in less obvious directions. We can’t say what those will be, but we’ll do our best to find out!
About the Survey
The survey collected responses from 1,549 individuals, geographically distributed across the US. 52.36% were female, and 47.64% were male.
38.34% earn less than $50,000 per year, 31.56 earn between $50,000 and $100,000 per year, 13.3% earn between $100,000 and $150,000, and 9.88% earn over $150,000. 6.91% of respondents preferred not to disclose their age.
20.92% of respondents were aged 18-29, 26.21% were 30-44, 28.21% were 45-60, and 28.21% were over 60.
Copyright Information:
All the data included in this study is available via the public domain. This means all statistics may be copied without permission. We do, however, appreciate citation as the source via a link.