
The mere thought of reading through government forms might cause your eyes to roll. Remember that the forms companies have to file with the SEC are not just for the government. These forms are meant to keep investors (that’s you) up to speed on reporting companies’ latest developments, both positive and negative. They give you a full picture of a business’s essential stats: all of them, not just the ones that the company wants you to focus on.
There are a number of forms that companies submit to the U.S. Securities and Exchange Commission (SEC). Don’t worry, you don’t have to read all of them from top to bottom. The idea is to pinpoint the essential filings and scan for the most relevant data points – and the Form 10-Q will generally be among the most important ones.
Don’t be daunted by the prospect of combing through 10-Q Forms. They’re actually quite manageable from a reader’s perspective – and once you learn the ins and outs of the 10-Q, it can be a handy guide by your side.
What Is a 10-Q Form, and What Are its Limitations?
Let’s start with the basics, then. What is a 10-Q filing, anyway? It’s a form that publicly reporting companies are required to file in compliance with federal securities laws.
How Often Is a 10-Q Filed?
The “Q” in the form’s name gives a hint. It’s typically submitted by companies every quarter or three months (though technically, the requirement is that the 10-Q “must be filed for each of the first three fiscal quarters of the company’s fiscal year”). You can actually download one here to see a blank 10-Q example, along with the filing instructions for the form.
What’s In a Form 10-Q?
In broad terms, it should include a company’s unaudited financial statements for the quarter. Since they’re unaudited, they’re subject to change, but they should at least provide an accurate estimate of a business’s financials. Furthermore, a Form 10-Q is meant to include a continuing view of a company’s financial position during the year.
What’s the Difference Between a 10-Q and a 10-K?
Don’t confuse a 10-Q with a 10-K. While a Form 10-Q is submitted on a quarterly basis, a Form 10-K is an annual report that provides a business’s full-year overview of financial and operating results. Thus, a 10-K will give you a full-year wrap-up but a 10-Q offers more detail on what’s happened with a company during a recent three-month period.
It’s important to understand the limitations of a 10-Q vs. a 10-K. The information on a business is usually much less comprehensive in a Form 10-Q than you’d find in a 10-K: it focuses on operating results over the last three months, typically compared to the equivalent quarter a year ago.
The 10-K includes much more detailed information about the business, the products and services, the markets, risk factors, and longer-term developments and trends.
💡 An easy way to think of it is that current and past 10-Ks are your starting point when you begin to look into a company, and the 10-Q is a tool for keeping track of the latest developments at a company you’re already following.
Certainly, the 10-Q is a useful tool and it can provide a good snapshot of current conditions, but they have to be reviewed in the context of other documents, like current and past 10-Ks and should be used alongside broader industry research.
What the Forms Don’t Tell You
Each of these forms has a place in your stock research.
- The Form 10-K gives you a broad overview of a company’s operations and longer-term performance.
- The Form 10-Q gives you a detailed look at the company’s performance over the last three months.
Those are important things to know, but they aren’t enough. Perhaps the greatest limitation of both the 10-Q and 10-K is that they rarely provide detailed information about the industry in which a company operates, the broader industry trends, and the competitive environment.
☝️ Overall, while a Form 10-Q is a great way to keep up on a company you’re already following, it’s only one of many tools you’d use for evaluating the business as an investor.
Is a 10-Q an Earnings Release?
A Form 10-Q has things in common with an earnings release but they’re definitely not the same thing. It’s true that, like 10-Q Forms, earnings reports are typically released every three months and are meant to reflect a company’s financial and operating results. There are key differences to consider, however.
For one thing, a Form 10-Q is submitted to, and published by, the SEC. It’s an official government document, so there’s a layer of credibility there, even if it contains a company’s self-reported data that should be viewed through a common-sense filter.
In contrast, a quarterly earnings report is basically just a press release from a company. It’s not required, though investors might be alarmed if the company fails to publish an earnings release every quarter.
An earnings release will typically be hosted on a company’s own website, though a copy of it might also be republished by Reuters, Yahoo Finance, and other agencies and platforms. Meanwhile, Form 10-Qs are hosted on the SEC’s website (though they’ll sometimes be reproduced on a company’s own website, as well). You can search for a specific company’s Form 10-Qs here.
And, to be honest about it, Form 10-Qs are generally much more comprehensive and less one-sided than companies’ quarterly earnings press releases.
🤔 Think of the difference this way: A Form 10-Q conveys what a reporting company is required to disclose, while an earnings release conveys what the company wants to disclose, in a way that the company wants to present it to the public.
So, don’t be surprised if a company puts the positive data points at the top of an earnings report in large, bold font with bullet points. The less-than-stellar details, meanwhile, might be further down the page and displayed in tiny font. Call it misleading, or call it “public relations” if you’d like – either way, it’s permissible with earnings releases.
What to Look For in a Form 10-Q
We’ll use a real-life example of a 10-Q to show you some of the most relevant parts to scan for. It’s important to read the whole document, though SEC forms can be lengthy so that’s sometimes easier said than done.
The example we’ll use is PepsiCo’s Form 10-Q covering the second quarter of 2022, which can be viewed here. Note that the web address starts with “sec.gov,” so there’s assurance that it’s an official 10-Q Form.
It’s 59 pages long, but certain data points are particularly important for investors. Start with Item 1, the consolidated financial statements, divided into:
- an income statement,
- a cash flow statement,
- a balance sheet,
- and a statement of equity.
1. Consolidated Income Statement
First, on page 3 you’ll find a table containing PepsiCo’s consolidated income statement:
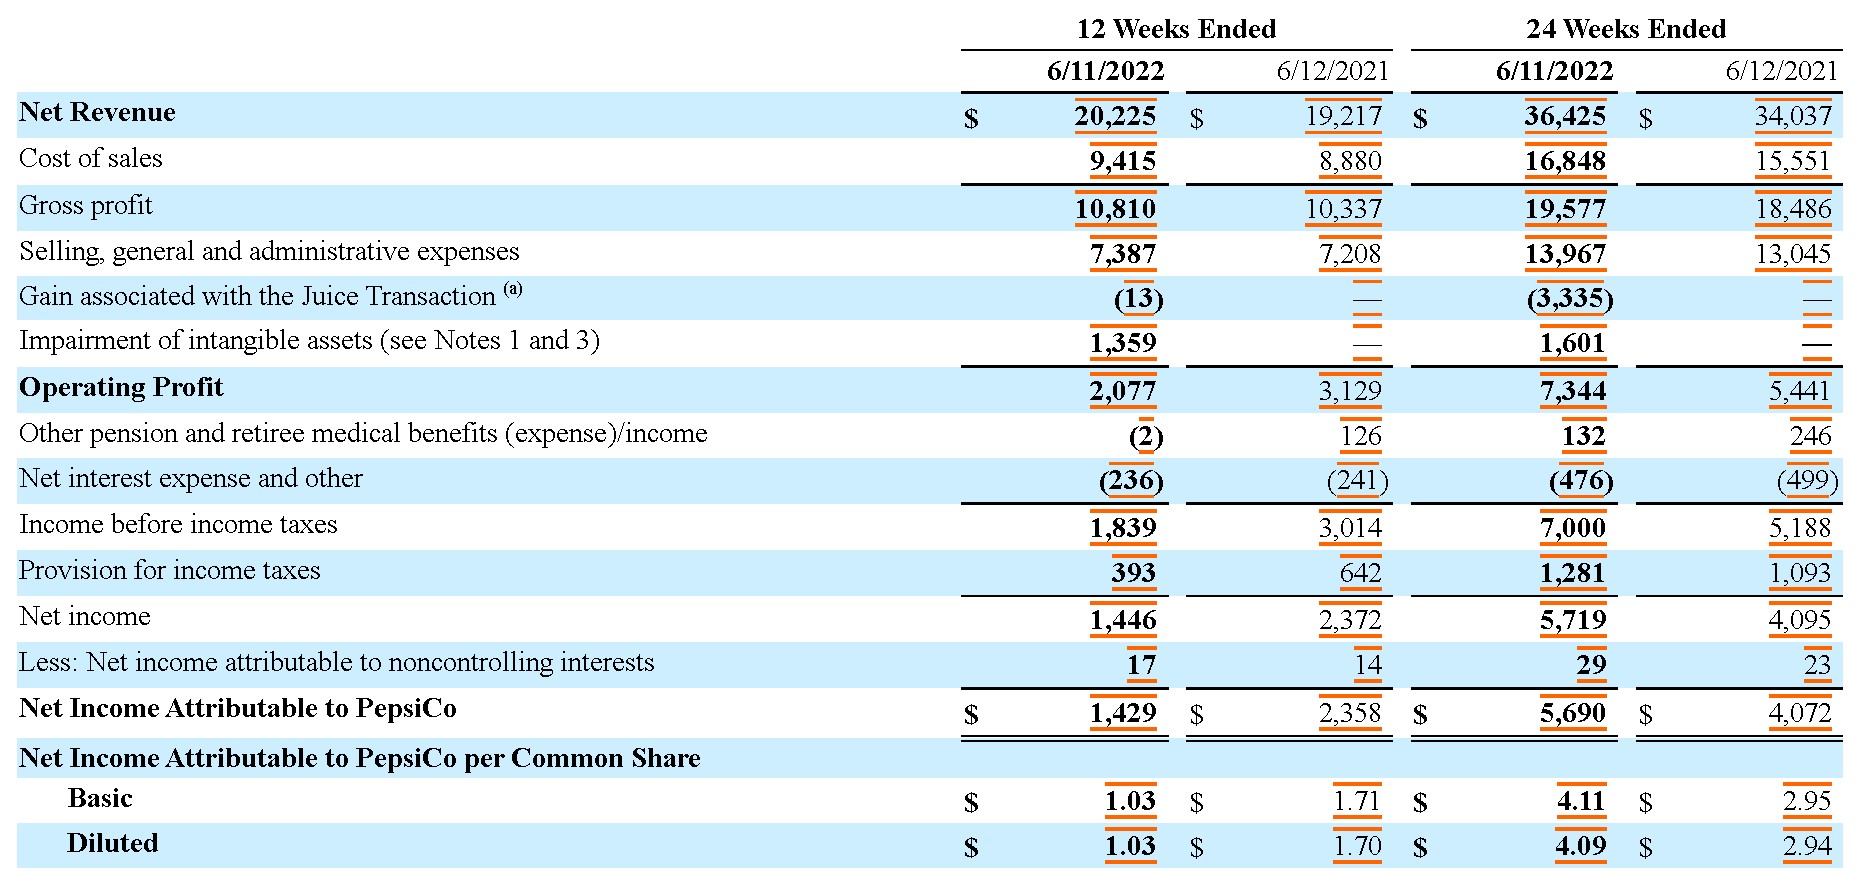
A quick-and-dirty measure of how much money is coming into the company through product and/or service sales is net revenue. In PepsiCo’s case, the company demonstrated growth in net revenue, from $19.217 billion in 2021’s second quarter to $20.225 billion in 2022’s second quarter (all figures in the table above are in millions of dollars). So far, so good.
For more of a bottom-line data point, you can check PepsiCo’s net income attributable to the company, which factors in PepsiCo’s revenue but also subtracts the company’s expenses.
Unfortunately, it turns out that PepsiCo’s net income attributable to the company shrank from $2.358 billion in the year-earlier quarter, to $1.429 billion in 2022’s second quarter.
2. Consolidated Statement of Cash Flows
The statement of cash flows lists all of the money coming into the company and going out of it, including depreciation and amortization, pension and retiree expenses, acquisition and divestiture-related charges, capital spending, investments, debt payments, and much more.
It may be difficult to interpret this information in isolation. There are two main ways to look at the figures.
- Check the current figures against the figures for the equivalent quarter last year. This will tell you how the company’s cash flow changed over the last year.
- Check the figures against those of leading competitors. This will tell you how the company’s cash flow stacks up relative to its industry.
If you see points that you’re curious about, you may want to look at past 10-Q and 10-K reports to get a broader picture.
3. Balance Sheet and Statement of Equity
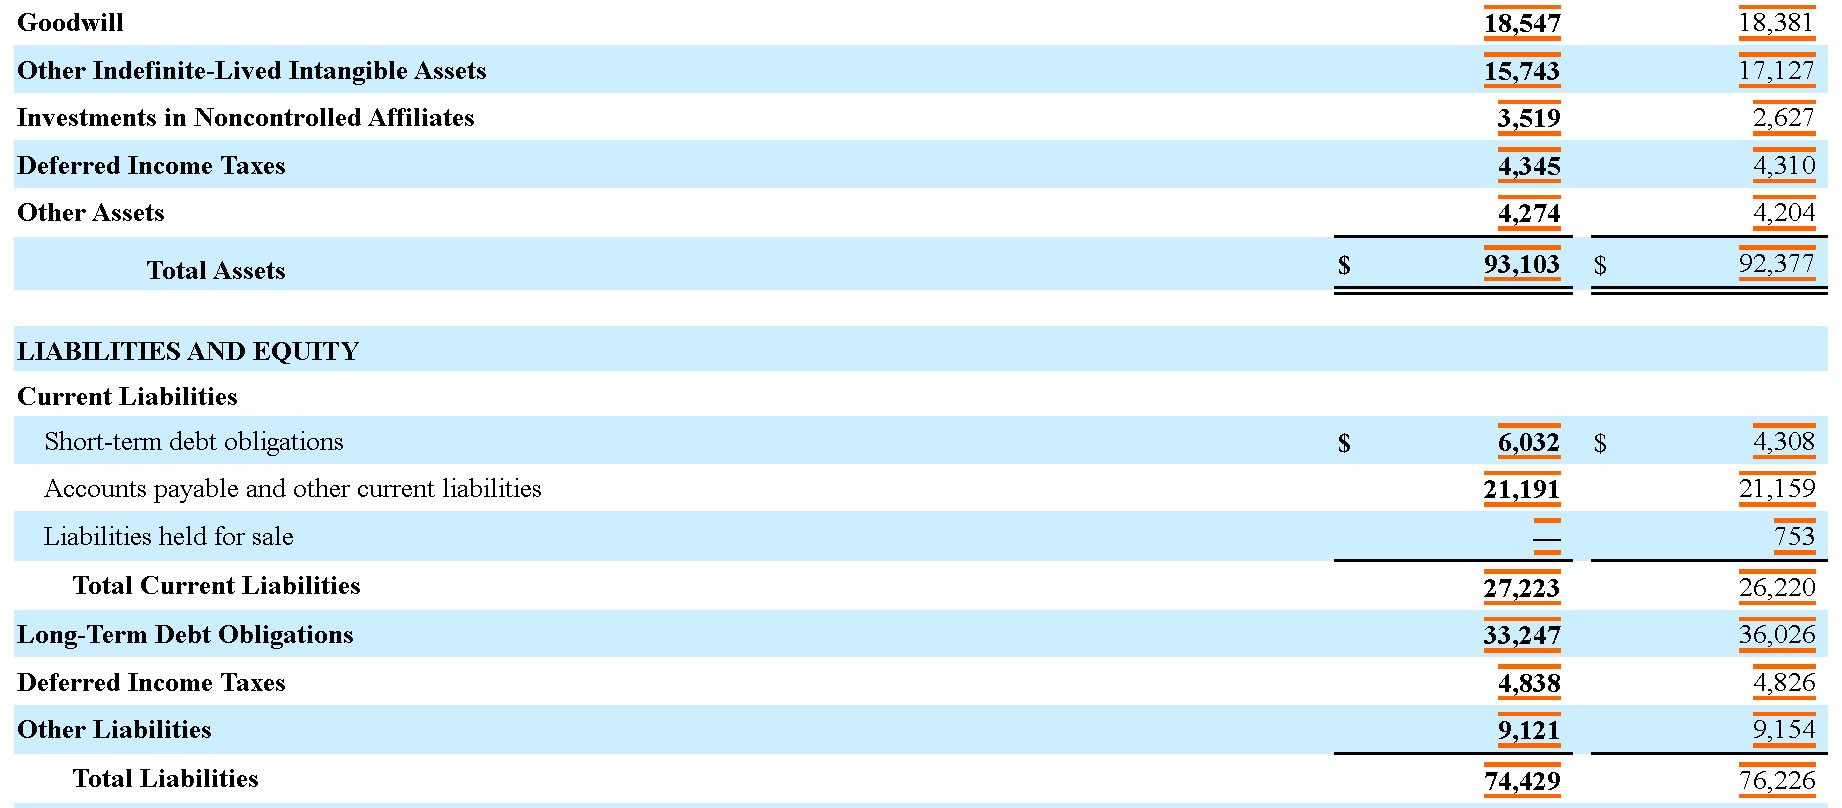
Further down the page, we can find a balance sheet: an inventory of PepsiCo’s assets (things that bring value to the company) and liabilities (things that take away value from the company).
The quick way to get to the crux of the matter is to scan for PepsiCo’s total assets (in this case, $93.103 billion as of June 11, 2022) and total liabilities ($74.429 billion as of that same date). These figures are not very different from the corresponding figures from December 25, 2021 ($92.377 billion and $76.226 billion, respectively).
The important consideration here is that PepsiCo’s assets haven’t changed much recently and that they’re substantially greater than the company’s liabilities. Certainly, that’s a positive sign for this popular soft-drink giant.
4. Statement of Equity
Below the balance sheet, you’ll find a statement of equity, a discussion of the Company’s outstanding shares, share repurchases, and earnings and losses per share.
You’ll want to monitor changes in the number of outstanding shares. Share repurchases reduce the number of outstanding shares and can add to the stock’s value. Share issuances dilute current shareholdings and can make shares less valuable.
Notes and Discussion
Below these financial statements, you’ll find two important sections.
- Notes to financial statements give details on events and trends during the quarter. There may be very few notes or many, but they are always worth a look, as they provide context for the numbers.
- Management’s Discussion and Analysis (MD&A) is the section where management explains the figures in their statements and any trends they feel require further information.
These discussions have to be taken with a grain of salt, as they involve management’s opinion of events, but there’s often valuable information there.
There’s More
Of course, there’s much more data contained in PepsiCo’s 59-page quarterly report. For example, you might be interested in learning how much of PepsiCo’s quarterly revenue came from Europe, Latin America, or the Asia-Pacific region. If you’re interested in such minutiae, you can find practically whatever quarterly data points you’re looking for in PepsiCo’s 10-Q Form.
You’ll also find disclosures of risks, legal proceedings, sales of equity securities, and more.
Learning to Read SEC Reports
Reading reports like the 10-Q and 10-K can be challenging at first. They are not entertaining, and they can seem extremely dry. There’s a lot of information, and you have to sift through it to focus on the pieces that interest you.
It’s worth the effort it takes to persist and get used to the style and structure of these reports. They contain much of the information you need to assess a company’s condition, and even the parts that seem irrelevant or hard to understand may be more important than they initially seem.
Over time and with practice, your eyes will become accustomed to scanning 10-Qs for the information that’s most relevant to you as an investor. Soon enough, you might find that corporate press releases have their place, but it’s the Form 10-Q that gives you the range of data you’ll need to make fully informed decisions.